Harvesting Growth: Inside Sprouts Farmers Market’s Earnings Acceleration
A Comparative Analysis of Four Mid-Cap Growth Stocks | February 2026
Recommendation: Sprouts Farmers Market (SFM)
After analyzing SEC filings, quarterly earnings, growth trajectories, and valuation metrics across all four companies, Sprouts Farmers Market (SFM) emerges as the strongest candidate for a blog feature article. It offers the most compelling accelerating-growth story: consecutive years of 50%→40% EPS growth, expanding margins, accelerating unit growth, a booming e-commerce channel, and a stock that has pulled back 36% from highs — creating a compelling technical setup for analysis.
Head-to-Head Scorecard
| Metric | WING | DECK | SFM | BURL |
|---|---|---|---|---|
| Market Cap | ~$7.8B | ~$13B | ~$6.8B | ~$17B |
| Stock Price | ~$271 | ~$100 | ~$70 | ~$290 |
| Annual EPS Growth | +57% → slowing | +19% → +8% | +50% → +40% | +46% → +16% |
| Revenue Growth (TTM) | +8% (decelerating) | +7-10% | +13-14% | +7-10% |
| Same-Store Sales | -3% to -4% | N/A (wholesale) | +5.9% (Q3) | +1% (Q3) |
| Gross Margin | ~82% (franchise) | ~57% | 38.7% (expanding) | 43.7% (expanding) |
| Unit Growth | ~19% (2,900+) | N/A (wholesale) | 37 new (→10%/yr) | 110 new (1,115) |
| ROE | Negative equity | ~35% | 38% | ~20% |
| Growth Trajectory | Decelerating | Steady/Slowing | Accelerating | Steady |
| BLOG GRADE | C | B+ | A | B |
1. Wingstop (WING) — Grade: C
Growth Story Cracking
Same-store sales guidance revised DOWN from +1% to -3% to -4% for FY2025
Wingstop had a phenomenal FY2024 with 36% revenue growth and 57.5% EPS growth, driven by 349 net new restaurants (15.8% unit growth), domestic AUVs hitting $2.1M, and 21 consecutive years of same-store sales growth. The franchise model (98% franchised) generates high-margin royalty streams with excellent capital efficiency.
However, FY2025 tells a different story. Revenue growth decelerated sharply to 8.1% in Q3 2025, and the company revised its domestic same-store sales guidance from +1% to a -3% to -4% decline — breaking that legendary 21-year streak. While unit growth remains robust at 19% (opening 114 restaurants in Q3 alone) and Adjusted EBITDA grew 18.6%, the loss of same-store sales momentum is a significant red flag. Bone-in chicken wing costs and increased interest expense from a $500M securitization are pressuring margins.
EPS Trajectory: FY2022: $1.77 → FY2023: $2.35 (+33%) → FY2024: $3.70 (+57%) → FY2025E: ~$4.28 (+16%) — growth is decelerating rapidly.
Why Not for Blog: The same-store sales decline makes this a difficult stock to feature in an accelerating-growth story. The stock is down 30% from its 52-week high. While the unit economics are still strong, the narrative has shifted from “growth powerhouse” to “working through a soft patch.” Q4 FY2025 results (Feb 18, 2026) may clarify direction, but the current setup doesn’t support the accelerating-earnings thesis.
2. Deckers Outdoor (DECK) — Grade: B+
Premium Brands, Strong Cash
$2.1B cash, >$1B buyback, HOKA growing mid-teens, 57% gross margin
Deckers owns two powerhouse brands: HOKA (the fastest-growing athletic shoe brand in the market) and UGG (iconic lifestyle footwear). The company’s fiscal year ends in March, so their “FY2026” is the current year. Q3 FY2026 (Dec 2025) just reported record results: revenue of $1.96B (+7.1%), diluted EPS of $3.33 (+11% YoY), and raised full-year guidance to $6.80-$6.85 EPS.
The financial profile is exceptional. Gross margins hover around 57%, operating margin at ~22.5%, and the company sits on $2.1B in cash with plans to repurchase over $1B in shares in FY2026. International revenue surged 38% in the first half. HOKA continues to take market share in the U.S. road-running category, and successful product launches (Mach 7, Speedgoat 7, Gaviota 6) and high full-price sell-through rates (~90% for top European HOKA customers) demonstrate brand strength.
EPS Trajectory: FY2023: $2.35 → FY2024: $3.70 → FY2025: $5.75-5.80 (+57%) → FY2026E: $6.80-6.85 (+18%) — growth moderating from explosive pace.
Why B+ but Not Top Pick: Deckers is an excellent company, but revenue growth is decelerating (from 17% to 7.1% in the latest quarter), and Q4 faces ~200bp gross margin headwind from the full 20% tariff burden ($110M unmitigated impact). The growth trajectory is strong but moderating, not accelerating. Additionally, HOKA’s growth rate is expected to slow to 13-14% in Q4 and UGG to roughly flat. This is a premium quality company with steady growth, but the acceleration story is fading.
3. Sprouts Farmers Market (SFM) — Grade: A
TOP PICK — Best Accelerating Growth Story
EPS: $2.50 → $3.75 → $5.26 (three years of consecutive acceleration). Revenue +13-14%. Comps +5.9%. E-commerce +21%. ROE 38%. Stock -36% from highs = compelling entry setup.
Sprouts Farmers Market is the standout performer in this group. The company has delivered a rare trifecta of accelerating earnings, expanding margins, and accelerating unit growth — the hallmarks of a true growth compounding story. Here’s the earnings trajectory that makes the case:
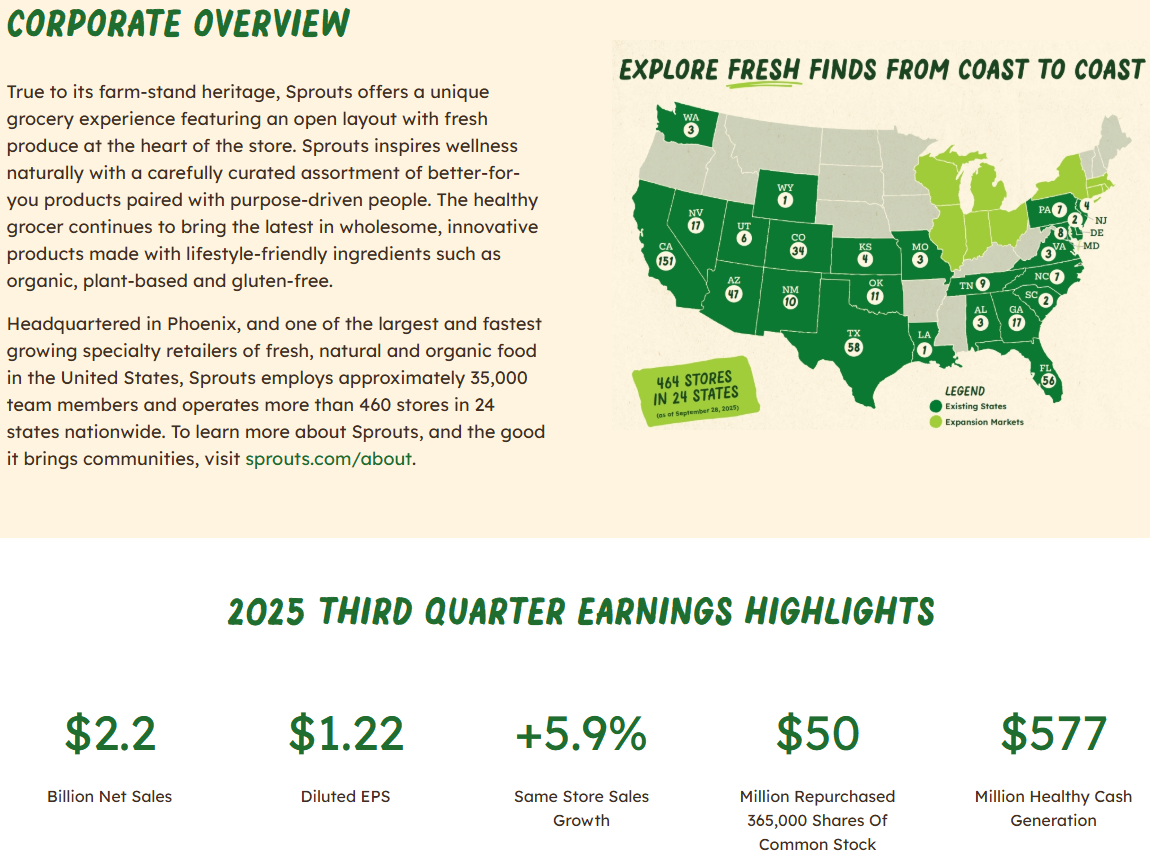
Click to enlarge — SFM corporate overview: 464 stores in 24 states, Q3 2025 highlights
| Fiscal Year | Annual EPS | YoY Growth | Revenue |
|---|---|---|---|
| FY2022 | $2.39 | +14% | ~$6.4B |
| FY2023 | $2.50 | +5% | ~$6.8B |
| FY2024 | $3.75 | +50% | ~$7.7B |
| FY2025 (Guidance) | $5.24-$5.28 | +40% | ~$8.8B (+14%) |
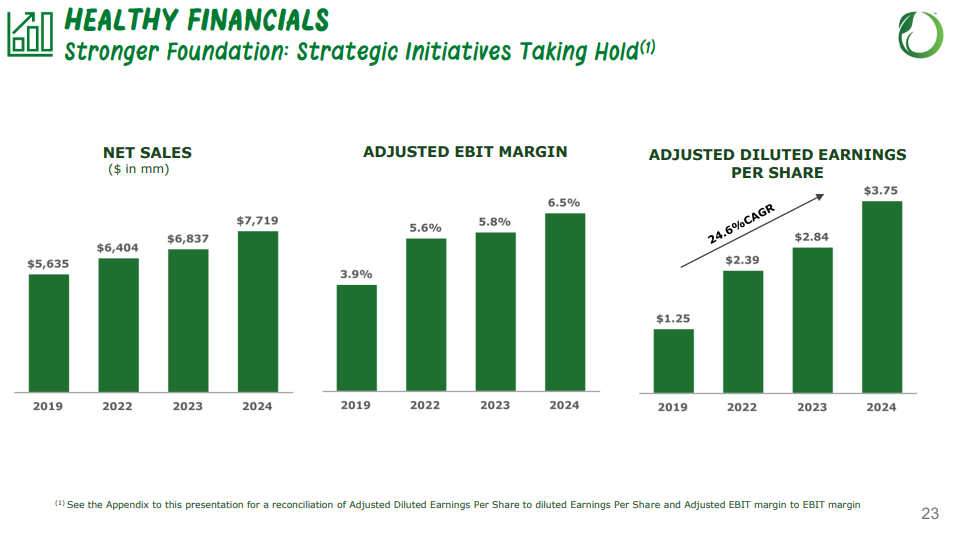
Click to enlarge — SFM financials: Net Sales to $7.7B, EBIT margin expanding to 6.5%, EPS at 24.6% CAGR
Quarterly EPS Beat Streak (FY2025):
| Quarter | EPS | YoY Growth | Revenue | Comp Sales |
|---|---|---|---|---|
| Q1 2025 | $1.81 | +55% | $2.1B | +8.4% |
| Q2 2025 | $1.35 | +44% | $2.2B | +8.4% |
| Q3 2025 | $1.22 | +34% | $2.2B | +5.9% |
| Q4 2025 (Guide) | $0.86-$0.90 | +8-14% | ~$2.4B | 0-2% |
Key Growth Drivers from SEC Filings:
Revenue Engine: Net sales grew 13% in Q3 2025 to $2.2B, driven by 5.9% comparable store sales growth plus 9 new store openings (464 total stores in 24 states). Full-year guidance calls for ~14% total sales growth.
Margin Expansion: Gross margin improved to 38.7% (up 60 bps YoY), driven by improved shrink management. EBIT margin at 7.2%. Net margin at 5.93% with a 38% ROE — exceptional for grocery.
E-Commerce Surge: Online sales grew 21-27% YoY, now representing 15.5% of total sales — a digital moat that differentiates Sprouts from traditional grocers.
Private Label Power: Sprouts Brand now exceeds 25% of total sales, driving higher margins and customer loyalty. Organic products account for nearly one-third of all sales.
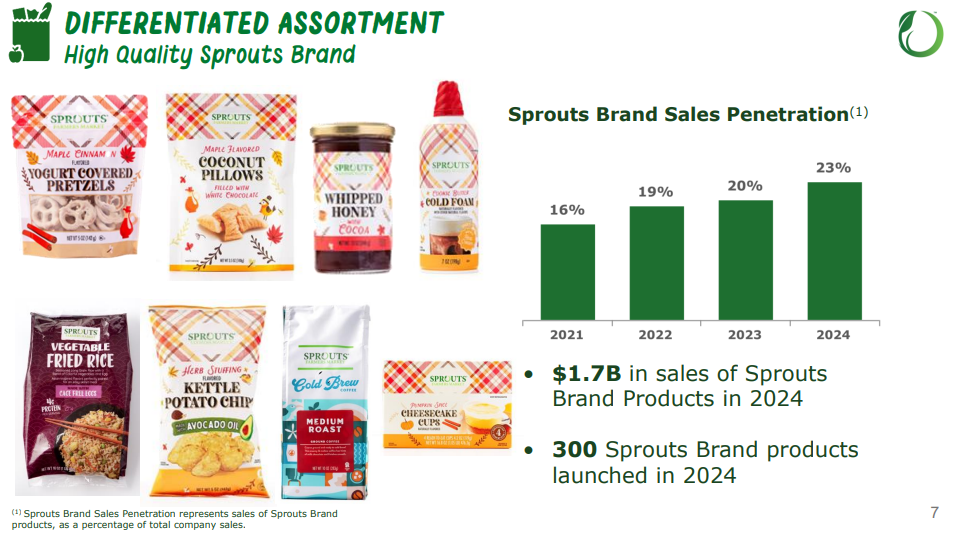
Click to enlarge — Sprouts Brand penetration: 16% (2021) to 23% (2024), $1.7B in private label sales
Unit Growth Acceleration: The company opened 37 new stores in FY2025 and is targeting acceleration toward a ~10% annual unit growth rate by 2027. Self-distribution for fresh meat and seafood (4 DCs transitioned, full transition by Q2 2026) will further improve margins.
Capital Returns: $577M in operating cash flow YTD, $342M in share repurchases with a $1B buyback authorization. Zero debt on the $600M credit facility.
Risk Factors: Q4 comp guidance of 0-2% suggests tougher year-over-year comparisons ahead. Securities class action litigation filed (class period Jun-Oct 2025). Stock dropped 27.7% after Q3 earnings on revenue miss despite EPS beat. Current price ~$70 is 36% off highs, which could signal a bottoming pattern or further downside.
Why #1 for Blog: Sprouts checks every box: accelerating EPS (50% → 40%), strong revenue growth (14%), expanding margins, accelerating unit expansion, growing e-commerce, rising private label penetration, and a stock that has pulled back significantly from highs. This creates a rich technical analysis narrative about growth at a reasonable price, with multiple chart patterns to analyze. Q4 results drop Feb 19, 2026, creating a timely catalyst. The company is familiar to consumers (everyone knows Sprouts), non-tech, and non-blue-chip — the ideal blog subject.
4. Burlington Stores (BURL) — Grade: B
Solid Operator, Growth Moderating
Adj EPS up 16-18%, but comp sales volatile and growth decelerating from FY2024’s 46%
Burlington is the #2 pure off-price retailer in the U.S. behind TJX Companies, operating 1,115 stores and targeting expansion to 2,000+ stores long-term. The “Burlington 2.0” strategy under CEO Michael O’Sullivan has been transformative: FY2024 delivered 11% total sales growth, 4% comp growth, and 48% net income growth to $504M ($7.80 diluted EPS). The company has a clear path to $16B in revenue and $1.6B in operating income by 2028.
FY2025 has been solid but less explosive. Q2 was strong (Adj EPS +39%, comps +5%, revenue +10%), but Q3 decelerated (Adj EPS +16%, comps +1%) due to unseasonably warm weather in major markets. The comp trend picked up to mid-single-digits in mid-October once weather cooled, and that trend continued into November. Full-year FY2025 Adjusted EPS guidance was raised to $9.69-$9.89 (+16-18% growth).
EPS Trajectory (Adjusted): FY2022: $4.25 → FY2023: $5.72 (+35%) → FY2024: $8.35 (+46%) → FY2025E: $9.69-9.89 (+16-18%) — growth is decelerating.
Why B but Not Top Pick: Burlington is a well-run company with a long growth runway, but the earnings acceleration peaked in FY2024 at +46% and is now moderating to +16-18%. Comp sales have been volatile (weather-dependent) and tariff pressure on merchandise margins introduces uncertainty. For a blog featuring accelerating growth, the narrative is less compelling than Sprouts. Additionally, at ~$290 and ~$17B market cap, it’s the largest company in the group.
Final Verdict
Sprouts Farmers Market (SFM) — The Blog Feature Pick
| Sector | Consumer Defensive / Specialty Grocery |
| Market Cap | ~$6.8B (mid-cap) |
| FY2025 EPS Growth | ~40% (following 50% in FY2024) |
| Revenue Growth | ~14% (accelerating unit growth) |
| Next Earnings | February 19, 2026 (Q4 + Full Year) |
| Stock Price | ~$70 (36% off highs — potential technical setup) |
| Consumer Familiarity | High — 464 stores in 24 states, well-known brand |
Sprouts delivers the most compelling narrative for TrendNalysis: a familiar consumer brand with explosive earnings growth, expanding margins, a growing digital business, and a stock trading at a significant discount to its highs. The upcoming Q4 earnings on Feb 19 provide a timely catalyst. This is the ideal candidate for a deep-dive technical analysis and earnings acceleration case study.
Disclaimer: This analysis is for educational purposes only and does not constitute financial advice. All data sourced from SEC filings (10-K, 10-Q), company press releases, and publicly available financial data. Stock investing involves substantial risk. Past performance does not guarantee future results. Always conduct your own research and consider consulting a licensed financial advisor before making investment decisions.