NVIDIA Corporation (NVDA): Deep Dive Analysis
Fundamental Analysis | Valuation | Competitive Landscape | February 2026
Price Target: $500 | Pre-Split Equivalent: $5,000
NVDA Snapshot — February 2026
Price & Market Cap
Current Price: ~$185
Market Cap: ~$4.49T
Shares Outstanding: 24.31B
52-Week Range: $86.62 – $212.19
Key Metrics (TTM)
Revenue TTM: ~$187B
Net Income TTM: ~$99B
EPS TTM: ~$4.08
P/E (TTM): ~45x
Q3 FY2026 Highlights
Revenue: $57.0B (+62% YoY)
Data Center: $51.2B (+66% YoY)
Net Income: $31.9B (+65% YoY)
EPS Diluted: $1.30
Company Overview
NVIDIA Corporation (NASDAQ: NVDA) is the world’s leading designer of graphics processing units (GPUs) and, more importantly, the dominant infrastructure provider for artificial intelligence. Founded in 1993 by Jensen Huang, Chris Malachowsky, and Curtis Priem, NVIDIA spent its first two decades building the gaming GPU market before pivoting to become the essential hardware layer for the AI revolution. That strategic foresight has made it one of the most valuable companies in history.
NVIDIA’s business is organized into two reportable segments: Compute & Networking (which includes Data Center AI accelerators, NVLink interconnects, and networking) and Graphics (gaming GPUs, professional visualization, and automotive). The Compute & Networking segment generated $116.2 billion in FY2025 — a 145% increase from FY2024 — and now overwhelmingly drives NVIDIA’s growth story. The company’s CUDA software ecosystem, developed over 17 years, creates deep switching costs that cement customer loyalty and justify premium pricing.
In June 2024, NVIDIA executed a 10-for-1 stock split. All share and EPS figures in this analysis are presented on a post-split, retroactively adjusted basis unless noted otherwise. Our price target of $500 per share represents a pre-split equivalent of $5,000.
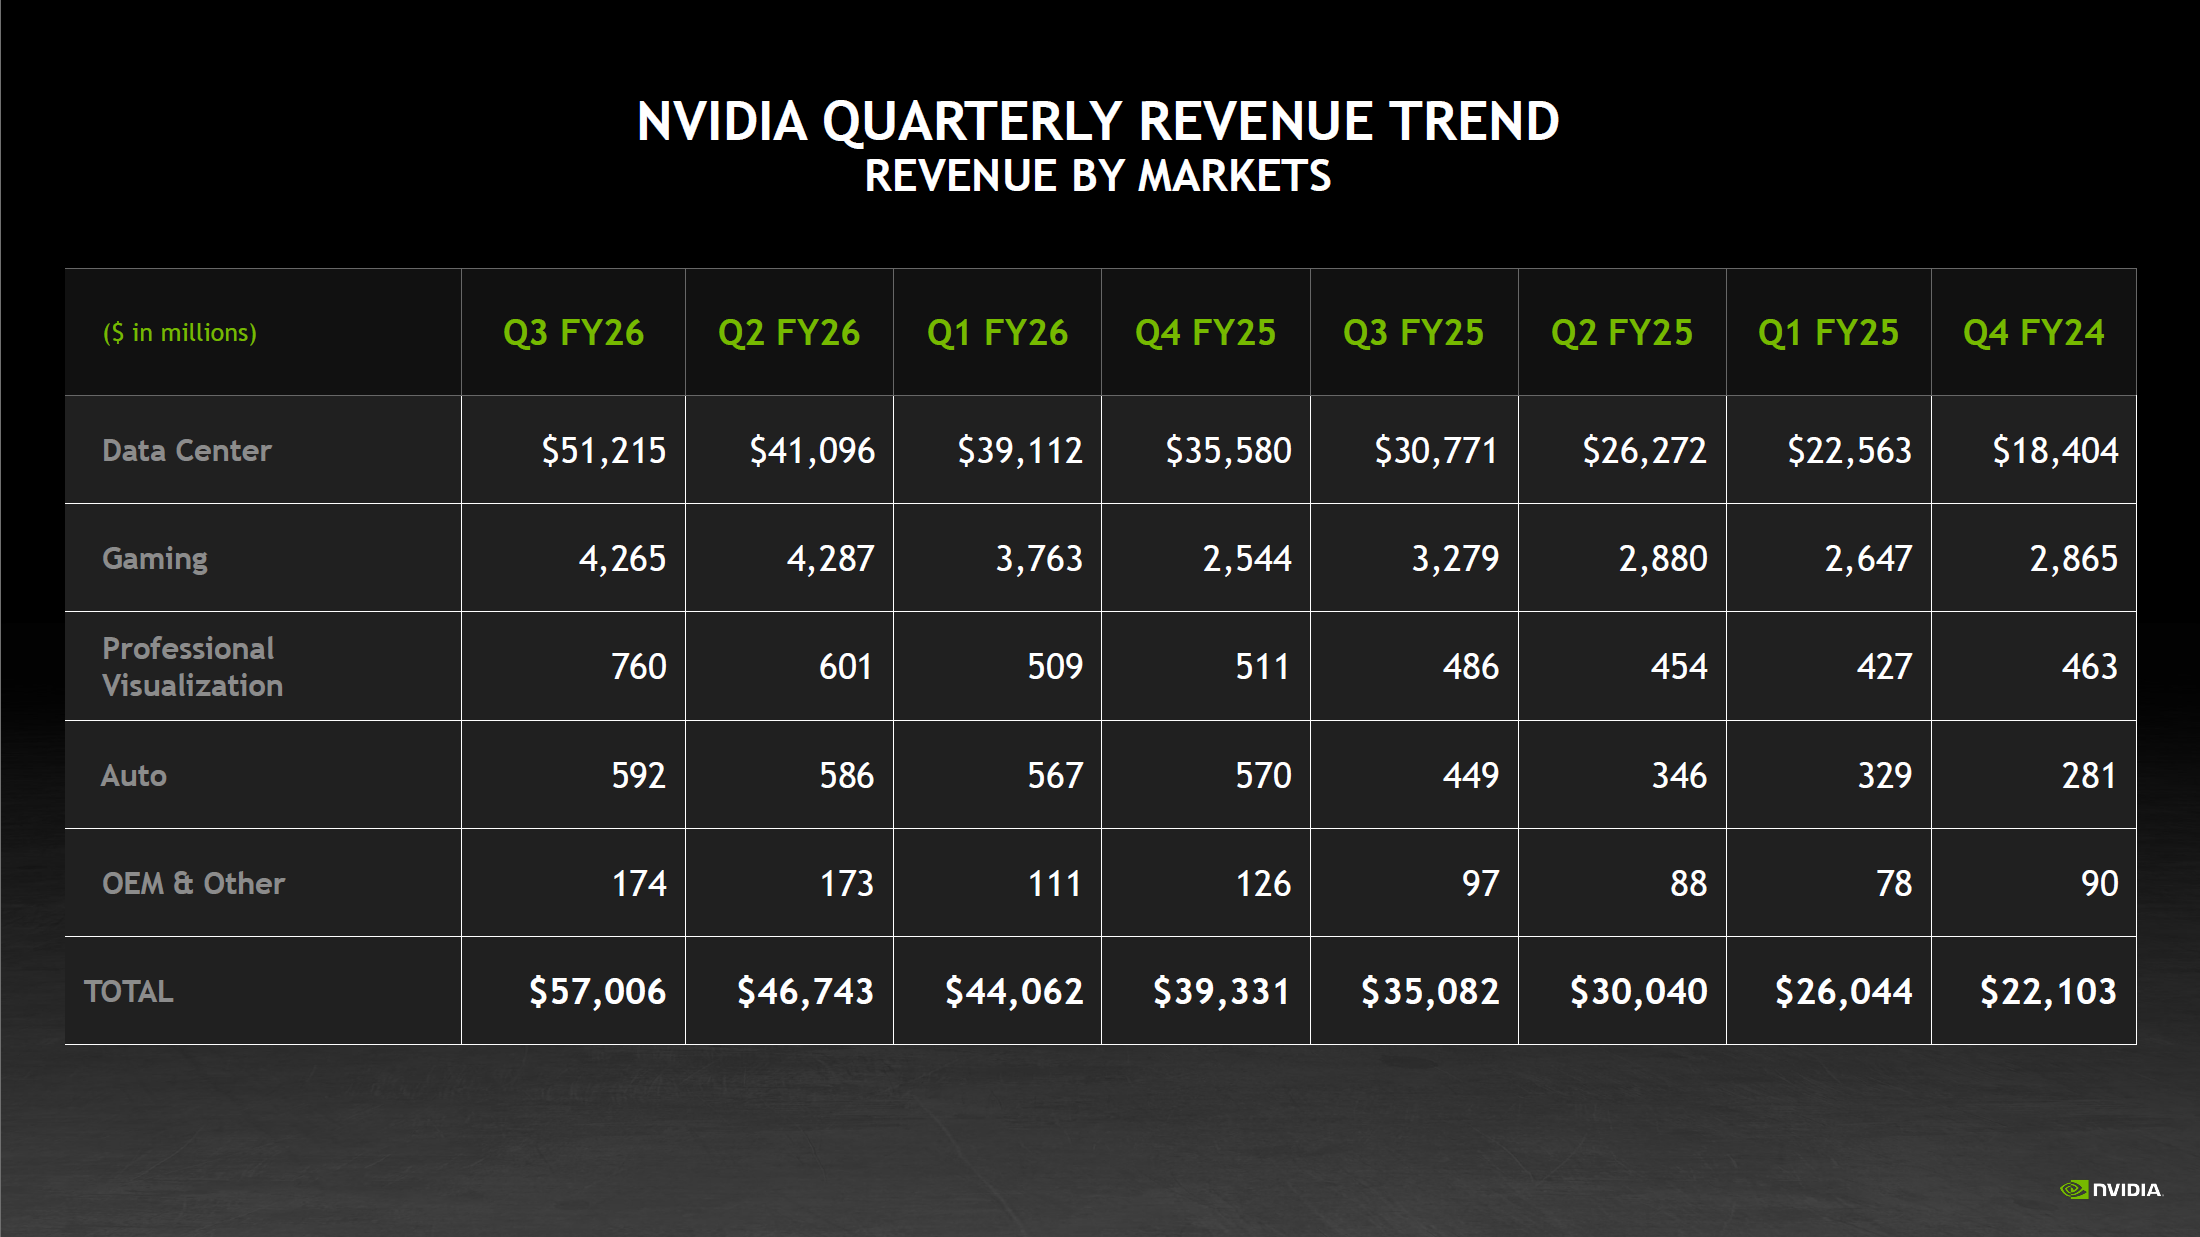
Click to enlarge — NVDA Quarterly Revenue Growth (FY2024–FY2026)
Financial Performance: Revenue & EPS CAGR
NVIDIA’s financial trajectory is historic in the semiconductor industry. Below is a four-quarter breakdown of its fiscal year data alongside the growth trajectory that underpins our $500 price target thesis.
Annual Revenue & Earnings History
| Fiscal Year | Revenue | YoY Growth | Net Income | EPS (Diluted) |
|---|---|---|---|---|
| FY2023 (Jan 2023) | $26.97B | +0.2% | $4.37B | $0.17 |
| FY2024 (Jan 2024) | $60.92B | +126% | $29.76B | $1.19 |
| FY2025 (Jan 2025) | $130.50B | +114% | $72.88B | $2.94 |
| TTM (thru Q3 FY26) | ~$187B | ~+63% | ~$99B | ~$4.08 |
Quarterly Revenue Progression (FY2026)
| Quarter | Total Revenue | Data Center | YoY Growth | EPS (Diluted) |
|---|---|---|---|---|
| Q1 FY26 (Apr 2025) | $44.1B | $39.1B | +69% * | $0.76 |
| Q2 FY26 (Jul 2025) | $46.7B | $40.9B | +56% | $1.08 |
| Q3 FY26 (Oct 2025) | $57.0B | $51.2B | +62% | $1.30 |
| Q4 FY26 Guidance | ~$65.0B | Est. ~$57B | — | Est. ~$1.45 |
* Q1 FY26 YoY growth impacted by a $4.5B charge for H20 GPU inventory write-down due to U.S. export restrictions to China.
Revenue CAGR (FY2023 → FY2025, 2-Year): +120% CAGR EPS CAGR (FY2023 → TTM): Approximately 316% 2-year CAGR (FY2023 EPS $0.17 → TTM $4.08). By any measure, this is among the most explosive earnings growth trajectories in the history of large-cap public companies.
Income Statement Deep Dive
Revenue Breakdown by Segment (Q3 FY2026)
| Segment | Q3 FY26 Revenue | % of Total | YoY Growth |
|---|---|---|---|
| Data Center | $51.2B | 89.8% | +66% |
| Gaming | $4.3B | 7.5% | +30% |
| Professional Visualization | $760M | 1.3% | +56% |
| Automotive & Other | $766M | 1.3% | +32%+ |
Data Center now constitutes nearly 90% of NVIDIA’s total revenue, reflecting the complete transformation of the business. This concentration is both a strength (massive pricing power, mission-critical infrastructure) and a risk factor (dependency on continued AI capex by hyperscalers). The Q3 FY26 Data Center performance was driven by Blackwell architecture GPU ramp, with cloud service providers representing just under 50% of Data Center revenue and large-model builders and enterprises making up the remainder.
Margin Analysis
| Margin Metric | FY2024 | FY2025 | Q3 FY26 |
|---|---|---|---|
| Gross Margin | 72.7% | 75.0% | 73.4% |
| Operating Margin | 54.1% | 62.4% | ~63% |
| Net Margin | 48.9% | 55.8% | 55.9% |
| R&D as % of Revenue | 14.2% | 9.9% | ~7.5% |
NVIDIA’s gross margins in the mid-70% range are exceptional for a hardware company and reflect the combination of premium Blackwell GPU pricing and the high-value software/platform stack (CUDA, AI Enterprise, NIM microservices) that accompanies it. The slight compression from 75.0% (FY2025) to 73.4% (Q3 FY26) reflects Blackwell ramp costs and initial production complexity — management has guided gross margins back toward 74.8-75% for Q4 FY26 as yields improve.
Balance Sheet Strength
NVIDIA’s balance sheet is a fortress. As of July 27, 2025 (Q2 FY2026), the company held $56.8 billion in combined cash and marketable securities against only $8.5 billion in long-term debt — a net cash position of approximately $48 billion. This gives the company exceptional financial flexibility for continued R&D investment, acquisitions, and share buybacks.
| Balance Sheet Item | Q2 FY26 (Jul 2025) | FY25 (Jan 2025) |
|---|---|---|
| Cash & Equivalents | $11.6B | $8.6B |
| Marketable Securities | $45.2B | $34.6B |
| Total Current Assets | $102.2B | $80.1B |
| Total Assets | $140.7B | $111.6B |
| Long-Term Debt | $8.5B | $8.5B |
| Total Shareholders’ Equity | $100.1B | $79.3B |
| Current Ratio | 4.2x | 4.4x |
| Debt-to-Equity | 8.4% | 10.7% |
NVIDIA returned $37 billion to shareholders in the first nine months of FY2026 alone through buybacks and dividends, reflecting the extraordinary cash generation of the business. Q1 FY2026 operating cash flow reached $27.4 billion in a single quarter — a figure that most S&P 500 companies cannot generate in an entire year.
Valuation Ratios
| Ratio | NVDA | Interpretation |
|---|---|---|
| P/E (TTM) | ~45x | Premium, justified by hypergrowth |
| P/E (Forward FY26E) | ~34x | More reasonable given growth rate |
| Price / Sales (TTM) | 24.3x | Elevated; reflects IP & platform moat |
| Price / Book | ~44.9x | High; off-balance-sheet CUDA moat |
| EV / EBITDA (TTM) | ~38x | Expensive vs. historical semis; in-line for AI leaders |
| ROE (TTM) | ~110% | Exceptional capital efficiency |
| ROA (TTM) | ~75% | Among highest of any mega-cap company |
| PEG Ratio (TTM P/E / Growth) | ~0.72 | Below 1.0 = potentially undervalued on PEG basis |
| Net Cash Per Share | ~$1.99 | $48B net cash / 24.31B shares |
The PEG ratio is particularly instructive. Despite NVDA’s seemingly high absolute P/E, when EPS growth exceeds 60% YoY, a PEG ratio below 1.0 suggests the stock is not inherently expensive relative to its earnings power trajectory. This is a key component of our bull thesis.
NVDA vs. AMD: Comparable Analysis
Advanced Micro Devices (AMD) is NVIDIA’s closest peer in AI accelerators and the most credible alternative for compute infrastructure. Below is a side-by-side comparison using the most recently available financial data.
| Metric | NVIDIA (NVDA) | AMD |
|---|---|---|
| Market Cap | ~$4.49T | ~$250–300B |
| Annual Revenue (Latest FY) | $130.5B (FY25) | $34.6B (FY25) |
| Revenue Growth (YoY) | +114% (FY25), +62% (Q3 FY26) | +34% (FY25) |
| Gross Margin | ~73–75% | ~50–53% |
| Net Margin | ~56% | ~10–12% |
| Net Income (Latest FY) | $72.9B | ~$3–4B |
| Annual EBITDA | ~$91B | ~$5.97B |
| Net Cash Position | +$48B | +$2.6B |
| P/E (TTM) | ~45x | ~80–100x |
| AI Accelerator Market Share | ~86% | ~10–13% |
| Software Ecosystem | CUDA (17+ years, dominant) | ROCm (maturing, v7.0) |
The scale disparity is stark. NVIDIA generated more net income in a single quarter (Q3 FY26: $31.9B) than AMD’s entire annual EBITDA ($5.97B). AMD’s data center revenue grew 122% YoY in recent quarters, and its MI300X and MI350X GPUs are winning inference workloads at cost-sensitive cloud customers — but NVIDIA’s CUDA ecosystem remains the dominant training platform with enormous switching costs.
GPU Market Share: The Moat Visualized
AI Accelerator Market Share (2021 → 2025)
| Company | 2021 | 2023 | Late 2025 | Trend |
|---|---|---|---|---|
| NVIDIA | 25% | 80% | 86% | ↑ Dominant |
| AMD | 7% | ~8% | ~10–13% | ↑ Gaining |
| Intel | 68% | ~12% | ~6% | ↓ Declining |
In just four years, NVIDIA captured market share that Intel had dominated for decades. The shift was accelerated by the generative AI boom beginning in 2022, but NVIDIA’s foundation was laid years earlier through CUDA, its developer community of 6 million+ users, and its Data Center networking acquisitions (Mellanox). Today, with 86% AI accelerator market share and hyperscalers spending a combined $380+ billion in AI capex annually, NVIDIA’s structural position appears defensible across multiple product cycles.
Consumer GPU Market Share (Gaming)
In the discrete consumer GPU market, NVIDIA holds approximately 82% of add-in board shipments as of Q4 2024, with AMD at 17% and Intel Arc at ~1%. This dominance, maintained through GeForce RTX product lines and DLSS/Frame Generation technologies, provides a massive installed base and ongoing stream of gaming revenue ($4.3B in Q3 FY26 alone) that supports continued R&D investment.
DCF Intrinsic Value Analysis
We conducted a Discounted Cash Flow (DCF) analysis using a WACC of 10% and a terminal growth rate of 2% (aligned with long-run GDP growth), representing a moderate valuation methodology. Our base case uses TTM free cash flow of approximately $100 billion.
Scenario Analysis
| DCF Scenario | Growth Yr 1–3 | Growth Yr 4–5 | Intrinsic Value / Share |
|---|---|---|---|
| Conservative | 30% | 15% | ~$129 |
| Base Case (Moderate) | 50% | 25% | ~$188 |
| Optimistic | 65% | 35% | ~$340 |
| Bull Case (Price Target) | 80%+ Yr1, 55% Yr2-3 | 30% | ~$500+ |
DCF Methodology Notes
Base FCF: ~$100B TTM | WACC: 10% | Terminal Growth: 2% | Shares: 24.31B | Net Cash Added: $48B
The base case ($188) aligns closely with the current stock price (~$185), confirming that the market is currently pricing in sustained hypergrowth. The $500 price target requires NVIDIA to continue executing a near-perfect AI infrastructure buildout cycle with annualized FCF scaling toward $300–400B by FY2029–2030 — achievable if Jensen Huang’s $3–4 trillion annual AI infrastructure spend thesis by 2030 materializes even partially.
Notably, NVIDIA itself anticipates $3 trillion to $4 trillion in annual AI infrastructure spending by 2030. If NVIDIA maintains even 25% of that total addressable market in revenue, that would represent $750B–$1T in annual revenue — a 4-5x increase from today’s TTM. At maintained net margins of 50%+, the free cash flow generated in that scenario would make a $500 share price appear conservative in retrospect.
Q4 FY2026 Guidance & Catalyst Watch
Management guided Q4 FY2026 revenue of approximately $65 billion (±2%), ahead of the Wall Street consensus of $61.7 billion. Key guidance metrics include gross margins recovering to 74.8–75% and operating expenses of approximately $6.7B (GAAP). Q4 guidance implies full FY2026 revenue of approximately $213 billion — a 63% increase from FY2025.
Key Upcoming Catalysts
Q4 FY2026 Earnings Report (Feb/Mar 2026) — First $65B+ quarter expected
GTC 2026 / Computex 2026 — Expected DGX Spark and next-gen GPU announcements
Vera Rubin Architecture (2026) — Next-generation successor to Blackwell
NVIDIA Helios Rack-Scale Systems — GB200 NVL72 and expanded NVLink deployments
Hyperscaler AI Capex Guidance — Microsoft, Meta, Amazon, Alphabet collectively guiding $380B+ for 2025
Key Risks to the Thesis
Export Restrictions (China): The U.S. government’s export licensing requirements have already triggered a $4.5B inventory charge for H20 GPUs in Q1 FY26 and materially reduced NVDA’s addressable market in China. Additional restrictions could further erode revenue. Chinese AI chipmakers (Huawei, Cambricon) are also developing competing accelerators.
Customer Concentration & In-House Silicon: Cloud hyperscalers (Microsoft, Google, Amazon, Meta) represent a substantial portion of NVDA’s Data Center revenue and all have active custom AI chip programs (TPUs, Trainium, Maia). Accelerated success of these internal chips could reduce dependence on NVIDIA hardware at the margin.
AMD Competitive Pressure: AMD’s MI350X claims 4x performance over the MI300X, and ROCm 7.0 is approaching CUDA feature parity for major frameworks. Oracle has committed 27,000+ MI355X accelerators. If AMD captures 20%+ of the AI accelerator market, it would represent a meaningful headwind to NVDA’s pricing power.
AI Capex Cycle Risk: The current AI infrastructure boom is driven by expectations of transformative ROI from generative AI. If enterprise AI adoption disappoints, or if hyperscaler capex spending is pulled back, NVDA’s order pipeline of ~$500B could erode faster than anticipated.
Valuation at Current Levels: At ~$185, the stock is pricing in continued execution. The conservative DCF intrinsic value of ~$129 means there is limited margin of safety at current prices. Any meaningful earnings miss or guidance cut could result in a sharp de-rating of the multiple.
Price Target Rationale: $500/Share
Our $500 price target (pre-split equivalent: $5,000) is a 2–3 year bull case target built on three pillars:
Pillar 1 — Revenue Trajectory: If NVDA achieves $65B in Q4 FY26, full FY2026 annualizes at ~$213B. Continued growth at even 35-40% in FY2027 yields $290-300B in revenue. At 50% net margins, that produces $145-150B in annual net income, or roughly $6/share EPS on 24B shares. A forward P/E of 35x on $6 EPS = $210/share — and that’s for FY2027 alone. As FY2028–2029 EPS accelerates toward $10-12/share, a 35-40x multiple reaches $350-480+/share.
Pillar 2 — Ecosystem Lock-In & Pricing Power: CUDA represents 17+ years of developer investment. Major frontier model builders — OpenAI, Anthropic, Meta, Google DeepMind — all train on NVIDIA hardware. This creates sustained revenue visibility. Jensen Huang’s reported $500B order backlog for 2025-2026 alone supports near-term growth confidence.
Pillar 3 — New Frontiers (Autonomous & Physical AI): NVIDIA’s Automotive segment is growing 32-72% YoY as self-driving platform adoption accelerates. Robotics (Isaac), physical AI, and sovereign AI data centers represent secondary growth vectors that are not yet significant but could materially expand the TAM well beyond the current data center AI buildout cycle.
TrendNalysis Analysis Summary: NVDA
Current Price: ~$185 | Price Target: $500 | Pre-Split Equivalent: $5,000
Upside to Target: +170% | Time Horizon: 2–3 Years | Risk Level: High
AI infrastructure dominance, 86% accelerator market share, and a $500B+ order pipeline support the long-term bull thesis — but the stock requires sustained execution and favorable macro conditions to reach the price target.
Disclaimer: This article is for educational purposes only and does not constitute financial advice or a solicitation to buy or sell any security. Options and stock trading involve substantial risk, including the potential loss of your entire investment. Past performance does not guarantee future results. The analysis and price targets presented here represent the author’s personal views based on publicly available financial data and should not be relied upon as the sole basis for any investment decision. Always conduct your own due diligence and consider consulting a licensed financial advisor before making investment decisions. NVDA is held as a position at the time of this writing.