Catching the Reversal: My QQQ Put Option Play
A Technical Analysis Case Study | February 2-3, 2026
📊 Week of Feb 2-6, 2026 | Weekly P/L: +202.3%
QQQ $614 Put – P/L: +202.3%
Bought: 2/2/26 @ $0.59
Sold: 2/3/26 @ $1.81
Exp: 2/4/26
The Setup
Not every trade is about chasing breakouts. Sometimes the most profitable opportunities come from recognizing when momentum has failed and a reversal is imminent. After /NQ failed to break through its previous high the week prior, I began watching for signs of a correction. When QQQ showed weakness at key resistance levels, I positioned for downside with a put option. This article walks through the technical signals that informed my bearish thesis and how the trade played out.
Position Details
| Underlying | QQQ (Invesco QQQ Trust) |
| Option Type | Put Option |
| Strike Price | $614 |
| Expiration | February 4, 2026 (2 days) |
| Entry Cost | $59.66 per contract (incl. fees) |
| Quantity | 1 contract |
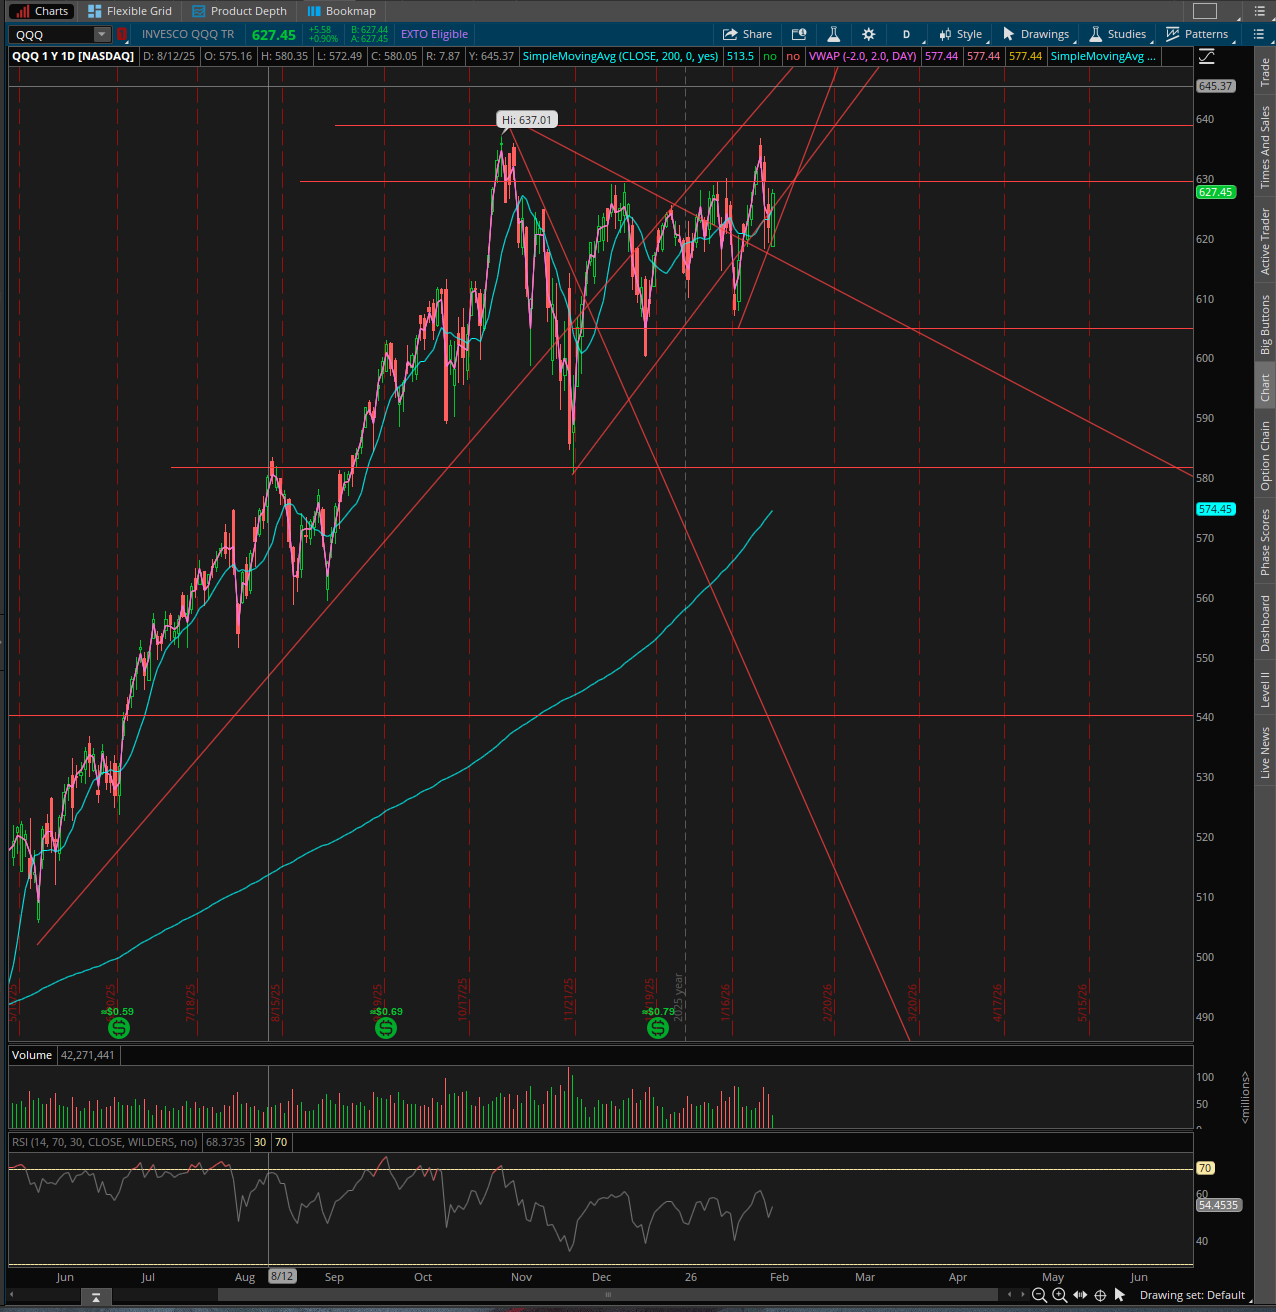
Click to enlarge – QQQ chart showing the failed breakout and reversal setup
Market Context: Why I Went Short
The previous week told a clear story: /NQ had attempted to break through its prior swing high but failed to maintain momentum. This type of failed breakout often signals exhaustion among buyers and can precede a meaningful correction. When markets can’t push higher despite bullish attempts, it’s a warning sign that sellers may be ready to take control.
On Monday, February 2nd, the market opened with a strong upward push, but I noticed something crucial – price wasn’t able to break above key resistance levels. More importantly, I observed that price had fallen below the 200-day Simple Moving Average (SMA), a major technical signal indicating potential downward momentum. When the broader market shows this kind of weakness while failing to reclaim important technical levels, it presents an opportunity to profit from the downside.
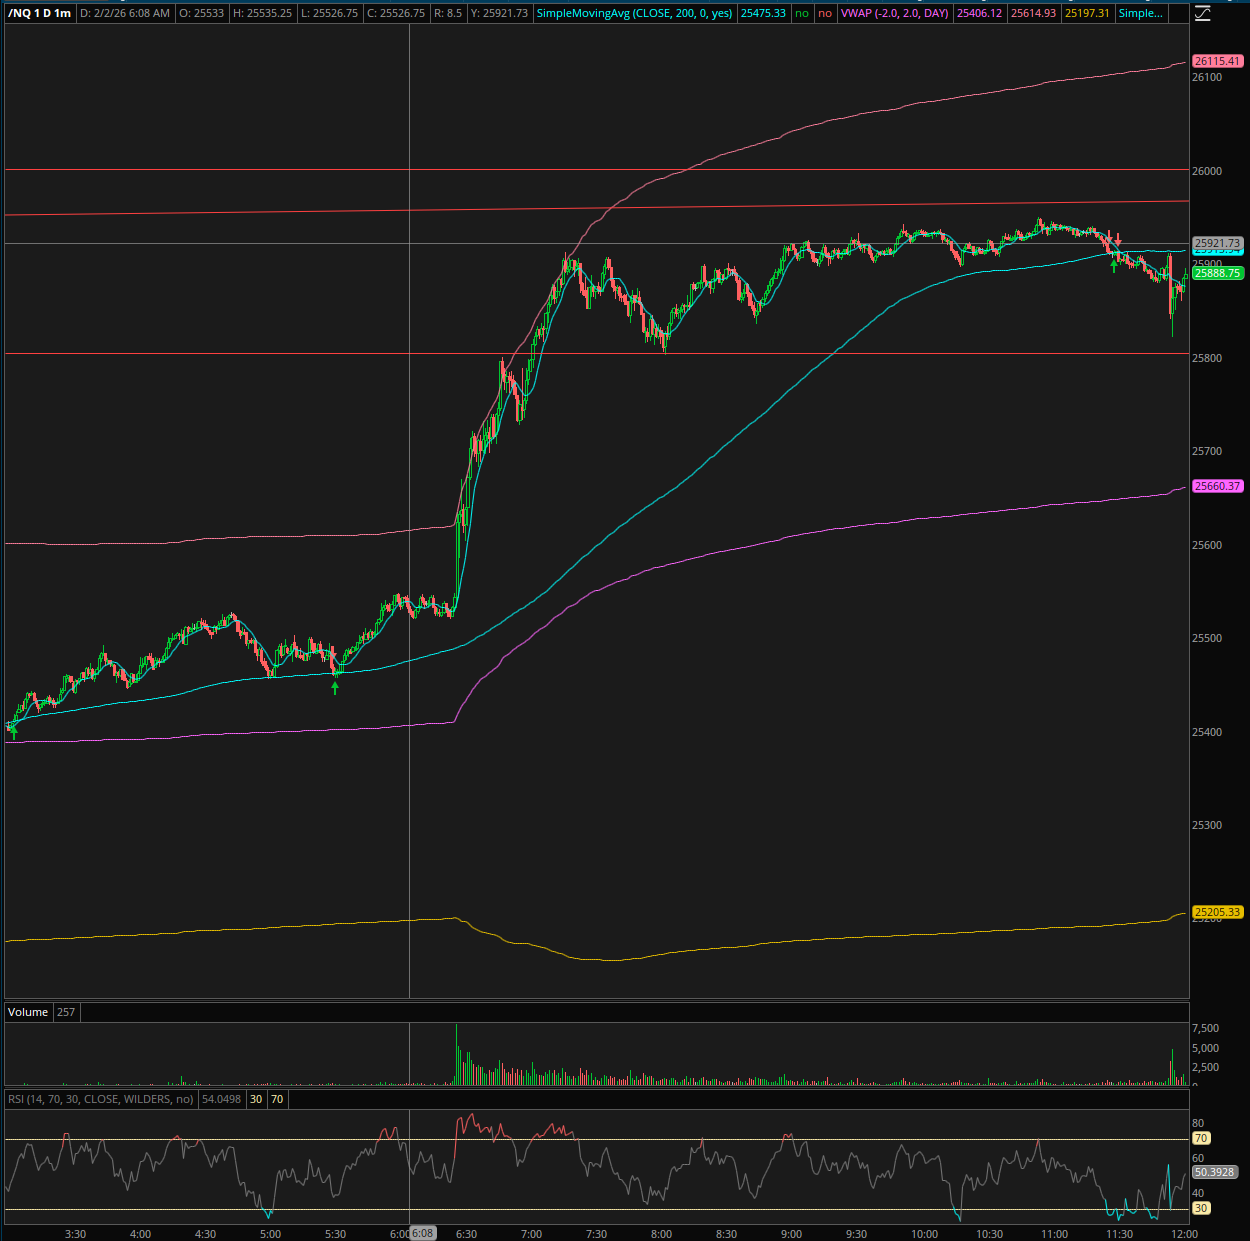
Click to enlarge – QQQ showing the 200 SMA breakdown and resistance rejection
Technical Analysis Indicators Explained
Several key technical indicators supported my bearish thesis:
1. Failed Breakout Pattern
A failed breakout occurs when price attempts to move above a significant resistance level but cannot sustain the move. This pattern is particularly powerful because it traps bulls who bought the breakout, forcing them to sell when the move reverses. The prior week’s rejection at the /NQ swing high created this exact setup – buyers had tried to push higher and failed, setting the stage for a reversal.
2. 200-Day SMA Breakdown
The 200-day Simple Moving Average is one of the most watched technical indicators by institutional traders. When price falls below this level, it often signals a shift from bullish to bearish sentiment. On Monday, I observed QQQ trading below the 200 SMA, which confirmed that the broader trend was weakening. This breakdown provided the conviction I needed to initiate a short position.
3. Key Resistance Rejection (629.5 Level)
I identified $629.50 as a critical price level for QQQ. During after-hours trading on Monday, the market tested this level but failed to break through, instead maintaining a sideways trend. When price repeatedly tests a resistance level without breaking through, it often signals that selling pressure is overwhelming buying pressure at that price. This rejection confirmed my bearish outlook heading into Tuesday.
4. Mean Reversion Setup
Markets tend to oscillate around their average prices. When extended moves fail to follow through, prices often revert toward the mean. The failed breakout created a mean-reversion opportunity – the market had stretched to test highs, failed, and was now positioned to correct lower. Put options profit from this exact scenario, gaining value as the underlying price declines.
Understanding Put Options
Put options give the holder the right to sell the underlying asset at the strike price. They profit when the underlying price falls below the strike price. Here’s why put options are powerful for bearish trades:
| Advantage | Explanation |
|---|---|
| Defined Risk | Maximum loss is limited to the premium paid ($59.66) |
| Leverage | Control 100 shares of QQQ for a fraction of the cost |
| No Borrowing | Unlike short selling, no need to borrow shares or pay margin interest |
| Asymmetric Returns | Potential for 200%+ gains with limited downside |
📋 After Action Report
Monday – Feb 2, 2026 (Position Opened)
Open: $618.69 | Mid-day: $627.50 | Close: $626.24 | Day Change: +1.2%
The day opened with the market showing strength, but I wasn’t fooled by the upward movement. Context mattered – the prior week had seen /NQ fail to break its swing high, signaling potential exhaustion. Despite the rally, price couldn’t push above key resistance levels, and critically, I noticed price had fallen below the 200 SMA.
At 12:08 PM PT, with QQQ trading around $627.50, I entered the $614 put position for $0.59 per contract. This strike was selected because it provided a good risk/reward ratio – far enough out of the money to be affordable, but close enough to profit significantly if my thesis played out.
After-hours trading confirmed my analysis: QQQ was unable to break through my key level of $629.50 and maintained a sideways trend. The bulls had tried and failed – the stage was set for Tuesday.
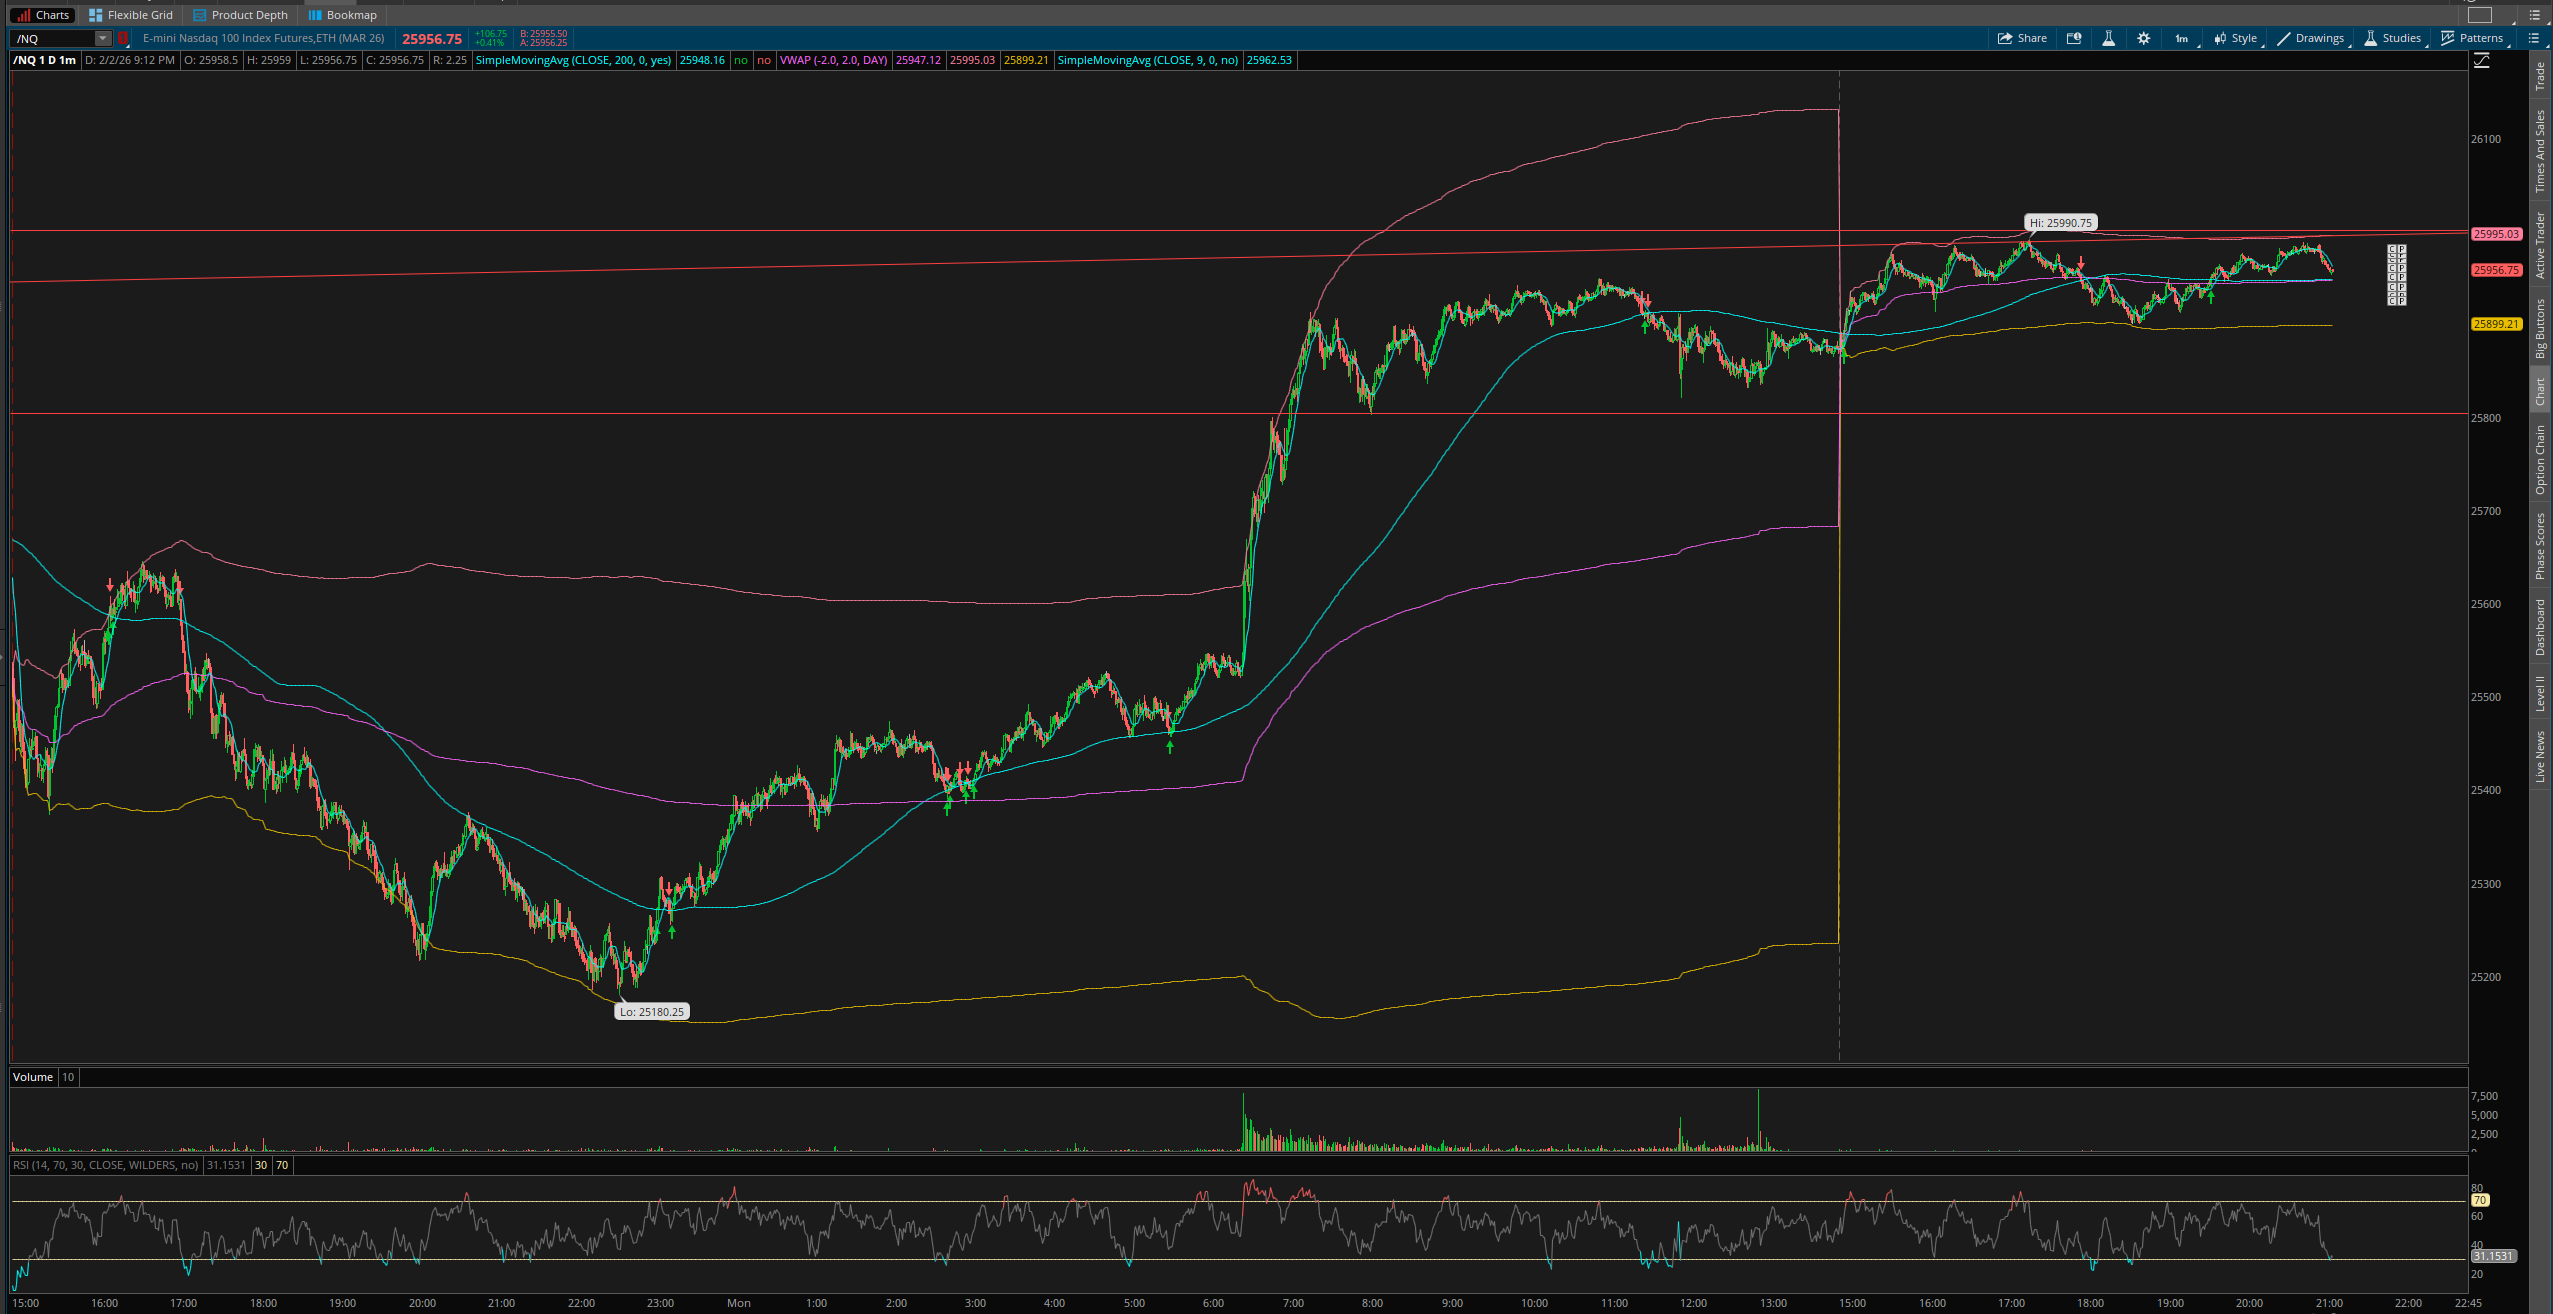
Click to enlarge – Monday after-hours showing rejection at $629.50 resistance level
Tuesday – Feb 3, 2026 (Position Closed)
Open: $628.28 | Mid-day: $614.50 | Close: ~$616 | Day Change: -1.7%
Position Closed: +202.3%
Tuesday morning delivered exactly what the technicals had suggested. The market opened and immediately began selling off hard. Within the first hour, QQQ plunged to $617.50, representing a significant -1.7% drop from Monday’s close. My put option, which I had purchased for $0.59, was now marked at $1.81.
At 7:17 AM PT, I made the decision to close the position and lock in profits. Net of fees, I realized a +202.3% return – turning my $59.66 investment into $180.34 in just over 19 hours.
Trade Results
Entry: $0.59 → Exit: $1.81 | Net Profit: $120.68 (+202.3%)
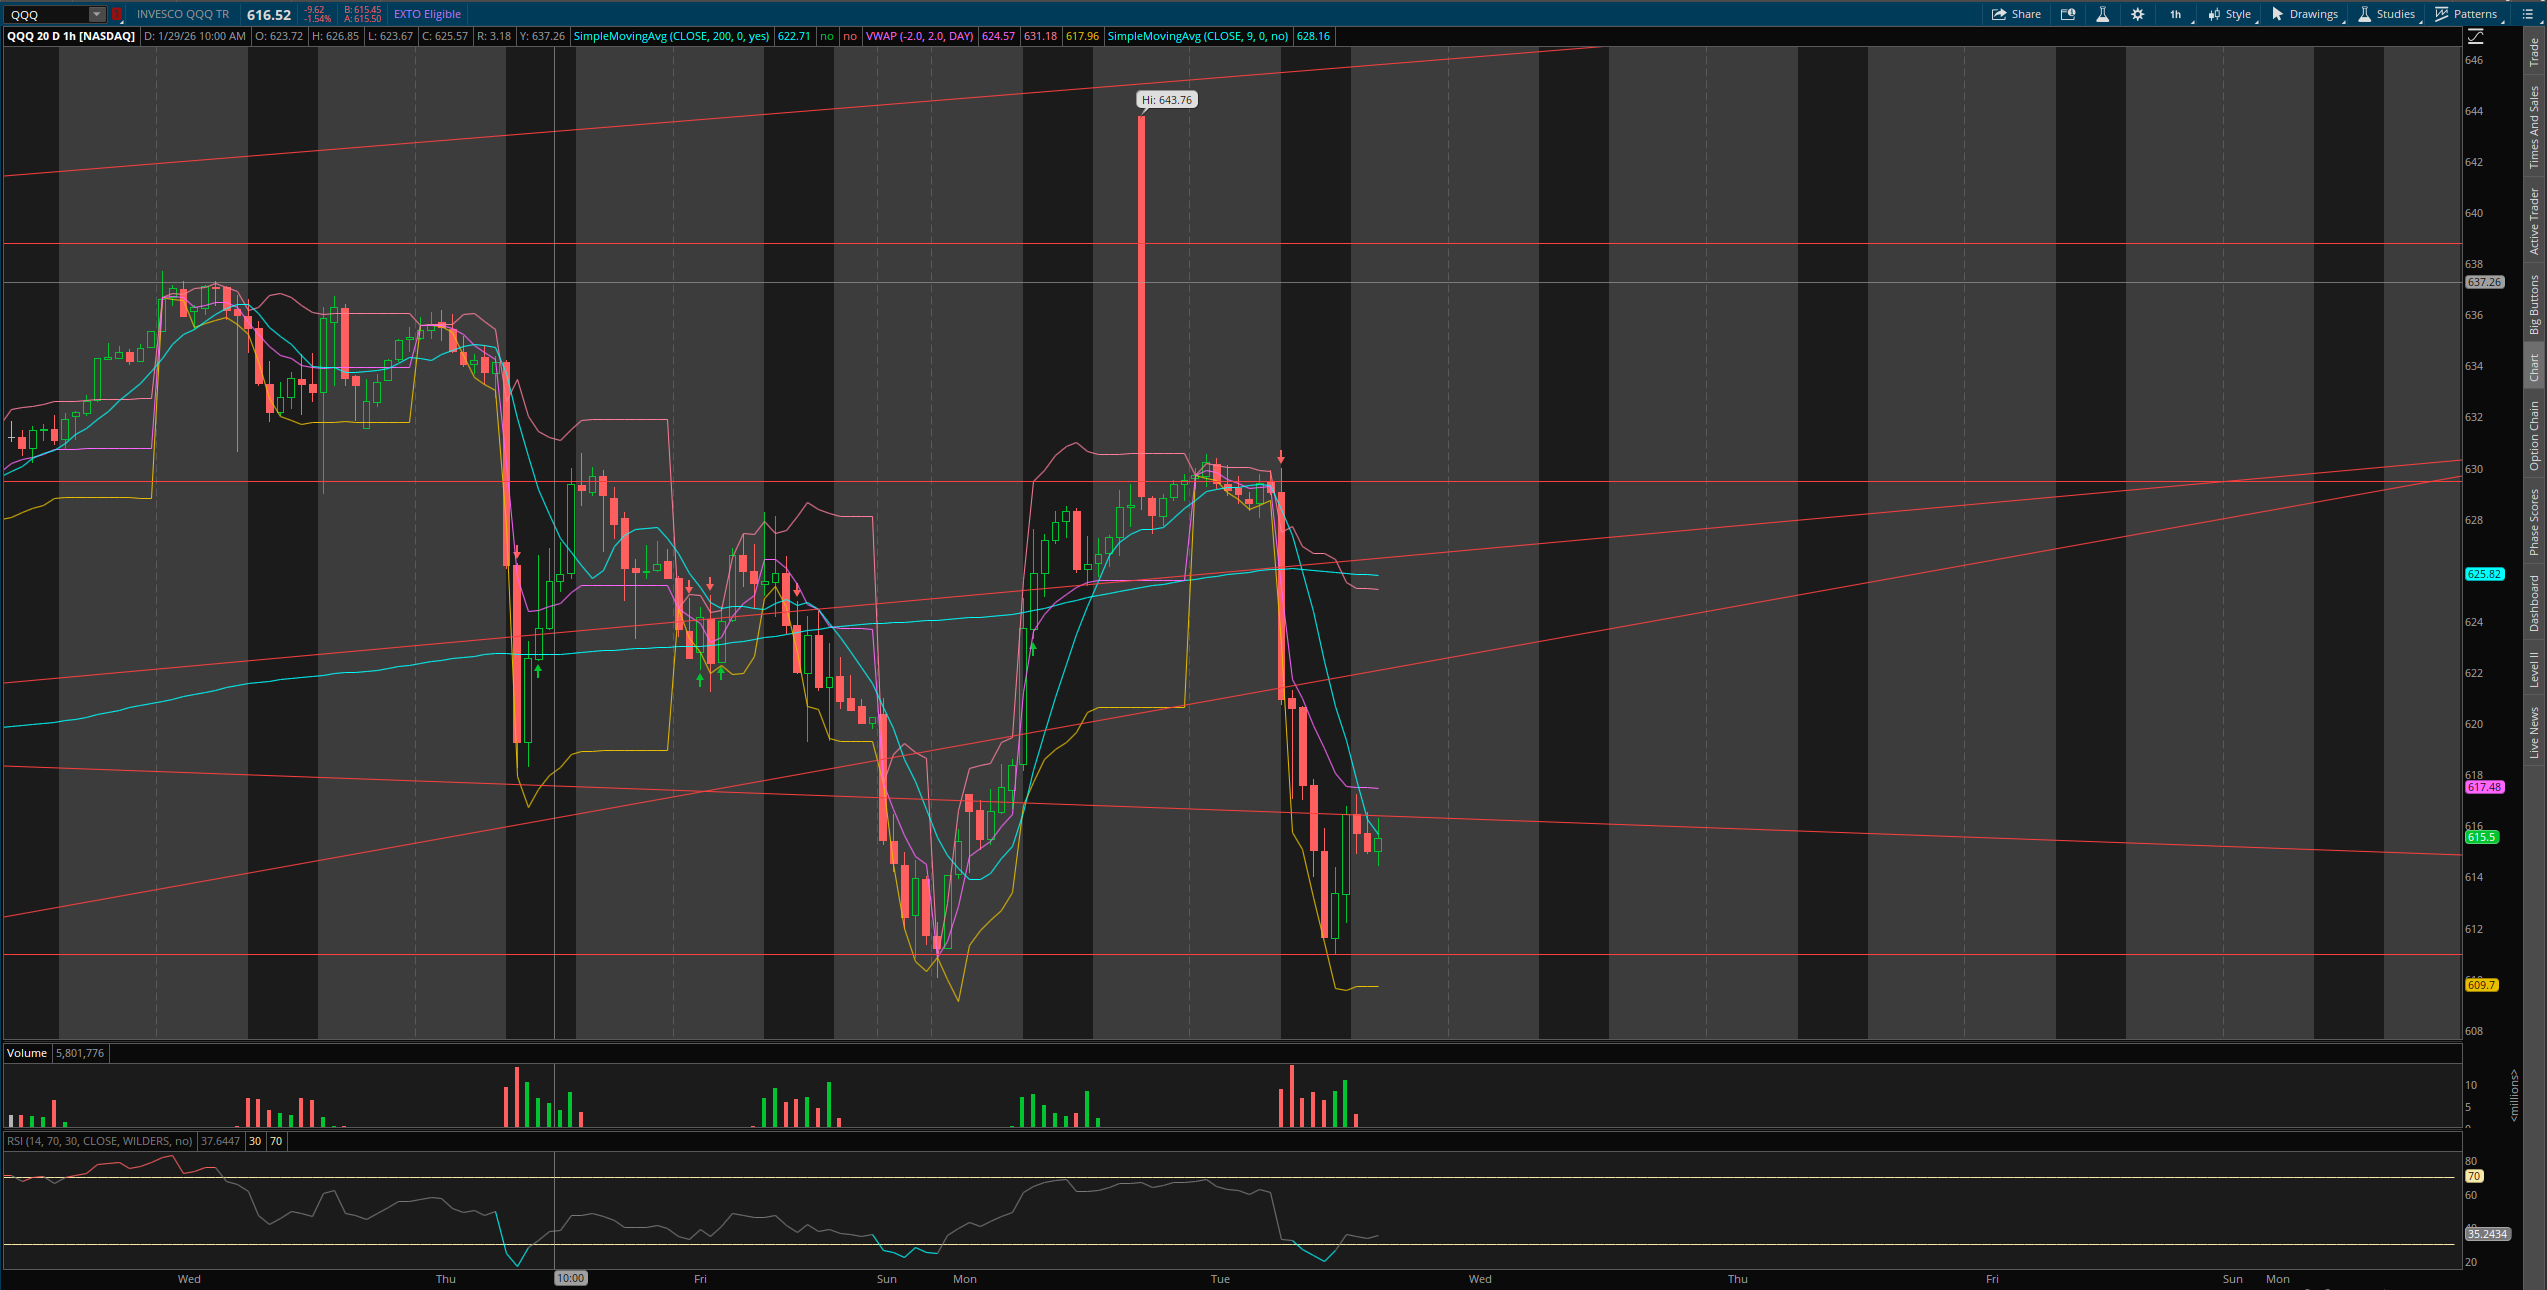
Click to enlarge – Tuesday’s selloff that drove the +202% put option profit
Hindsight Analysis
In hindsight, the strong downward movement on Tuesday signaled a full sell-off day, and holding the position longer could have yielded even greater returns. QQQ continued to trade below $614 approaching market close. However, given the prior day’s upward movement, I made the conservative choice to secure profits rather than risk a strong reversal. When price began consolidating around $617, I didn’t want to give back gains on a potential bounce.
The lesson: It’s often better to take profits and preserve capital than to chase maximum returns. A +202% gain in less than 24 hours is an exceptional outcome, and protecting those gains ensures I live to trade another day.
Key Takeaways
This trade illustrates several important principles:
Failed Breakouts Are Opportunities: When markets attempt to break key resistance levels but fail, it often signals a reversal. These failed moves trap bulls and create selling pressure that can fuel significant downside moves.
Respect the 200 SMA: The 200-day moving average is a critical technical level. When price breaks below it, the shift in sentiment can be swift and powerful. Use this breakdown as confirmation for bearish positions.
Put Options for Defined Risk: Rather than short selling (with theoretically unlimited risk), put options allow you to profit from downside moves with a known maximum loss. The premium paid is your only risk.
Take Profits: A 200%+ gain is extraordinary. Don’t let greed turn a winning trade into a losing one. Securing profits ensures you maintain your capital base for future opportunities.
Context Matters: This trade worked because I had been watching the market’s failed breakout attempt the prior week. Understanding the broader context – not just the current day’s price action – gave me conviction in my thesis.
Short-Term Options Amplify Moves: With only 2 days until expiration, this put option had high gamma, meaning its value changed rapidly with underlying price movement. This amplification works both ways – get it right and gains are explosive; get it wrong and theta decay destroys your premium quickly.
Weekly Result: +202.3%
Patience in identifying the setup, discipline in taking profits. A textbook reversal trade.
Disclaimer: This article is for educational purposes only and does not constitute financial advice. Options trading involves substantial risk and is not suitable for all investors. Past performance does not guarantee future results. Always conduct your own research and consider consulting a licensed financial advisor before making investment decisions.