Trading the Breakout: My VOO Call Option Play
A Technical Analysis Case Study | January 26–30, 2026
Week of Jan 26–30, 2026 | Weekly P/L: +21.96%
VOO $645 Call — P/L: -41.2%
Bought: 1/26/26 @ $0.81
Sold: 1/29/26 @ $0.48
Exp: 1/30/26
QQQ $636 Call — P/L: +102.6%
Bought: 1/29/26 @ $0.65
Sold: 1/29/26 @ $1.33
Exp: 2/2/26
The Setup
In trading, timing and conviction are everything. When I identified a potential breakout pattern forming in the broader market, I decided to position myself for upside exposure through a VOO (Vanguard S&P 500 ETF) call option. This article walks through the technical analysis indicators that informed my decision, the trade setup, and the key lessons from this position.
Position Details
| Underlying | VOO (Vanguard S&P 500 ETF) |
| Option Type | Call Option |
| Strike Price | $645 |
| Expiration | January 30, 2026 (3 days) |
| Entry Cost | $81.66 per contract |
| Quantity | 1 contract |
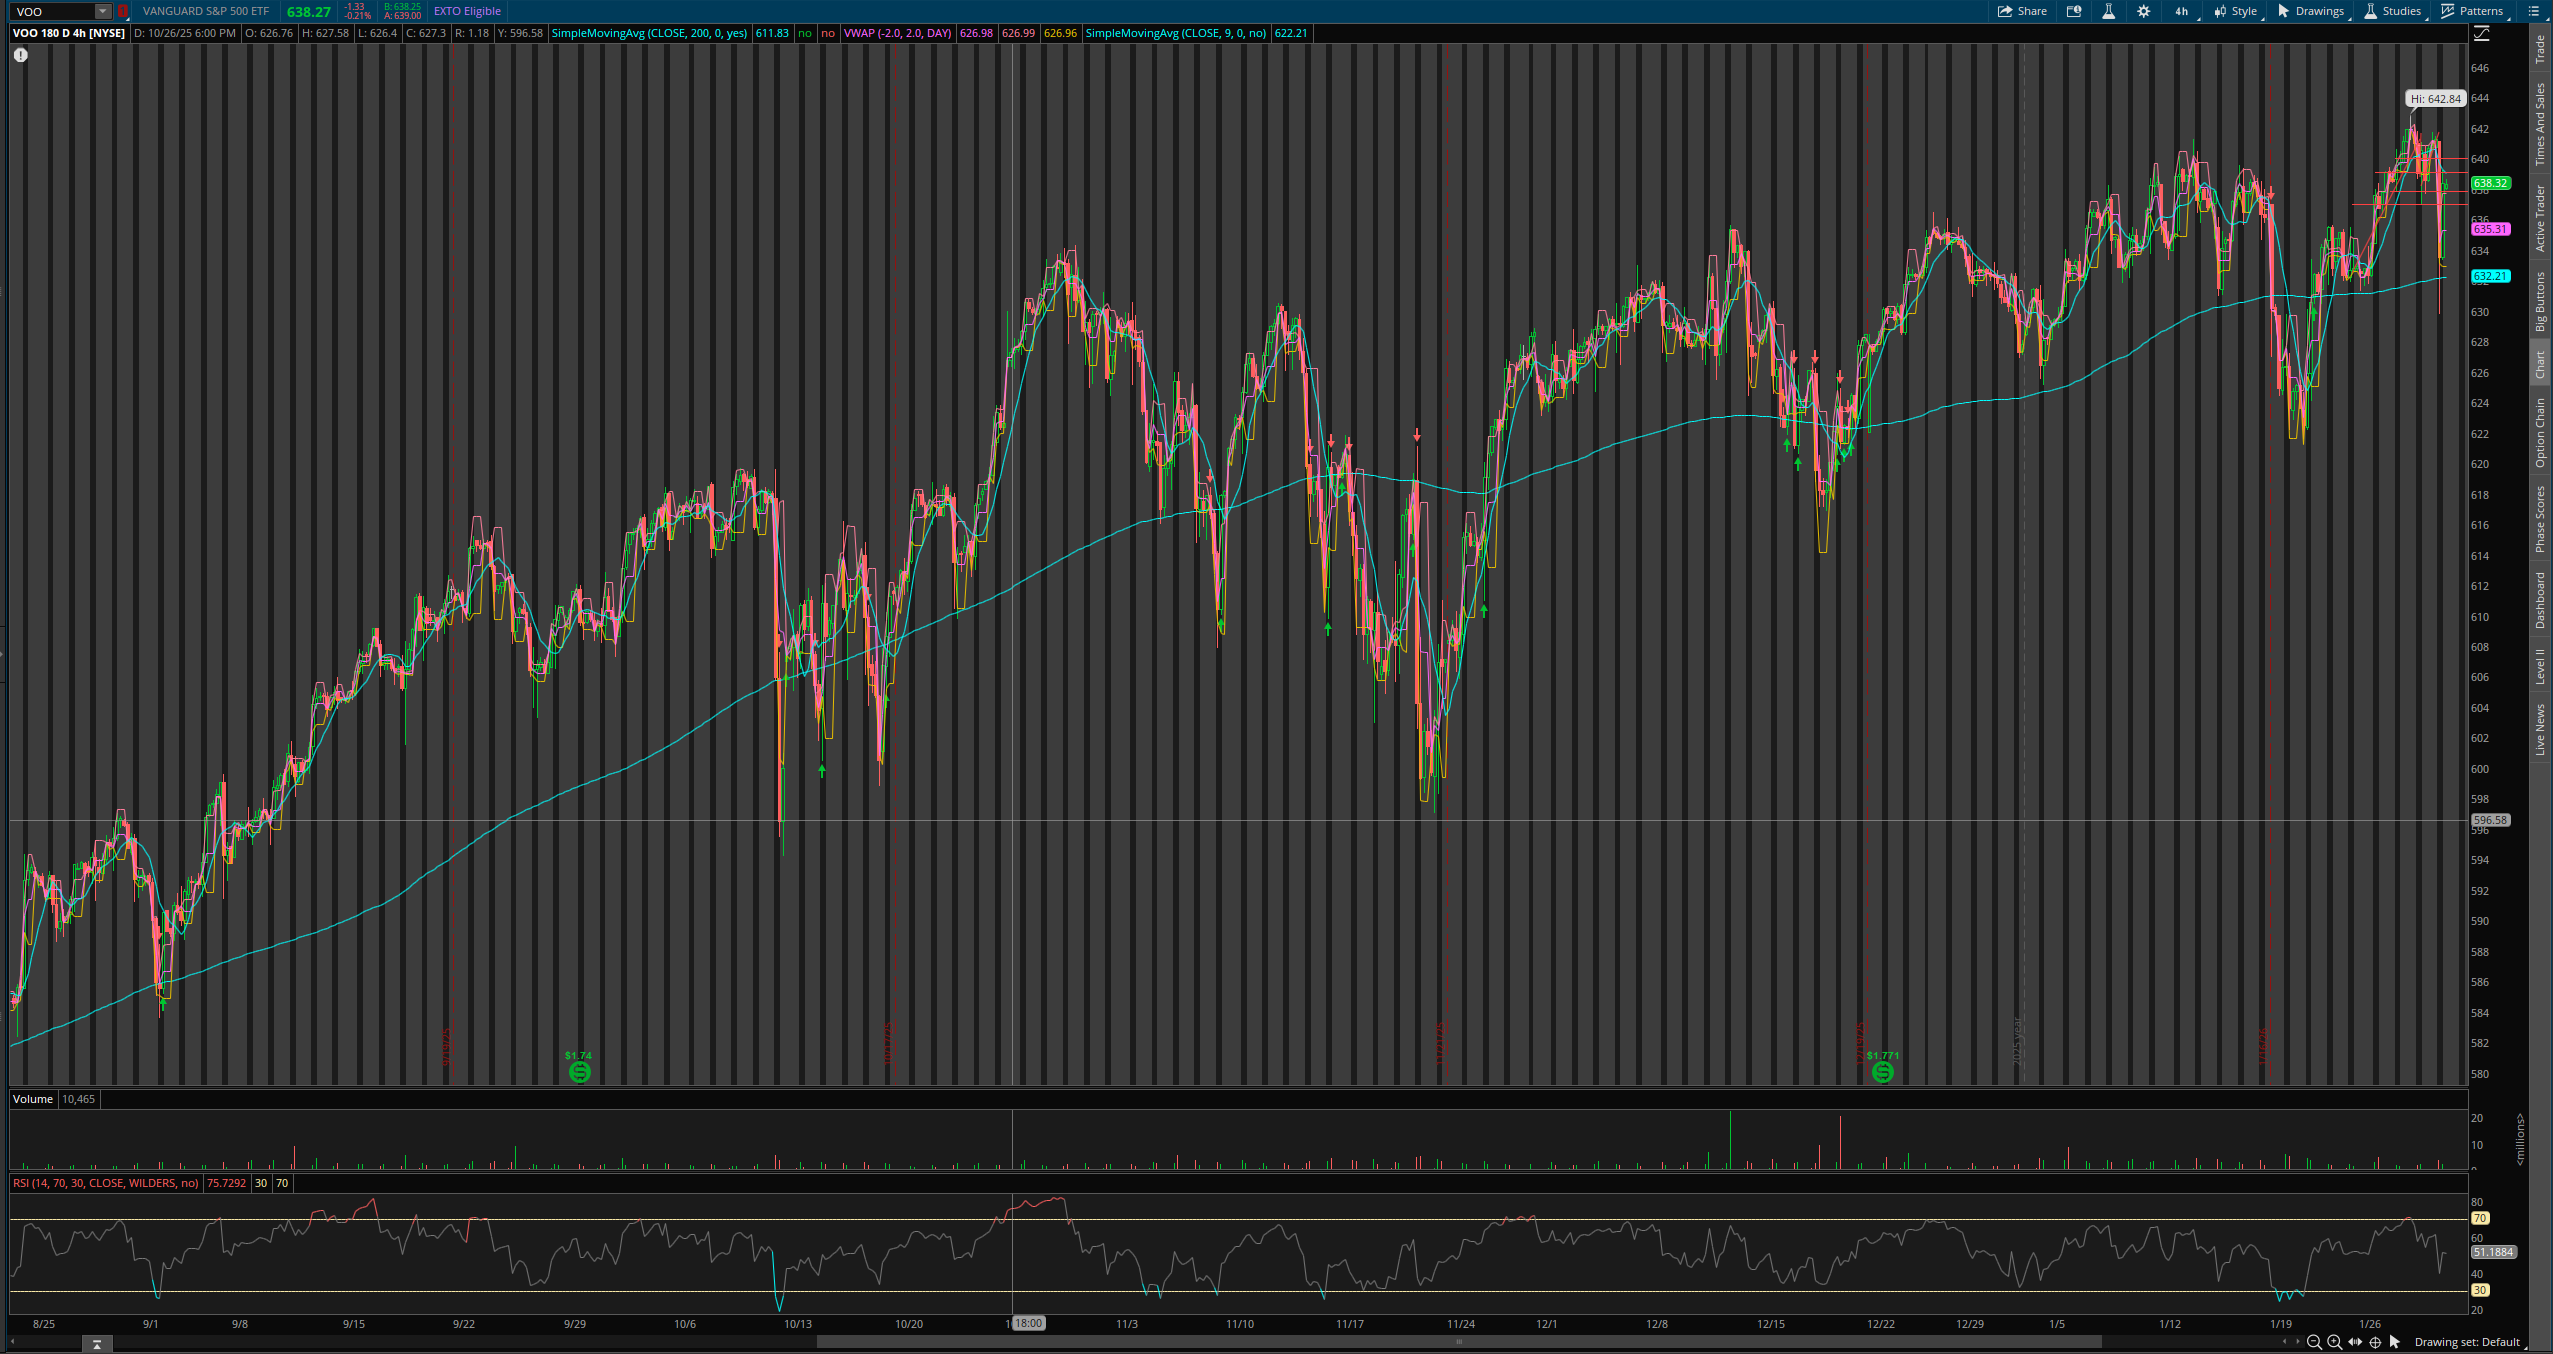
Click to enlarge — VOO 180-day chart showing uptrend and entry zone
Market Context: Why I Entered
The primary catalyst for this trade was the price action I observed in the Nasdaq 100 futures (/NQ). The market was exhibiting clear upward momentum, and I identified a critical inflection point where NQ appeared poised to break through its previous swing high. In technical analysis, a breakout above prior resistance is one of the most reliable signals of bullish continuation.
When the broader market (as represented by NQ) signals strength, correlated instruments like VOO typically follow. By positioning with a call option on VOO, I was betting on continued upside in the S&P 500 index with defined risk and leveraged upside potential.
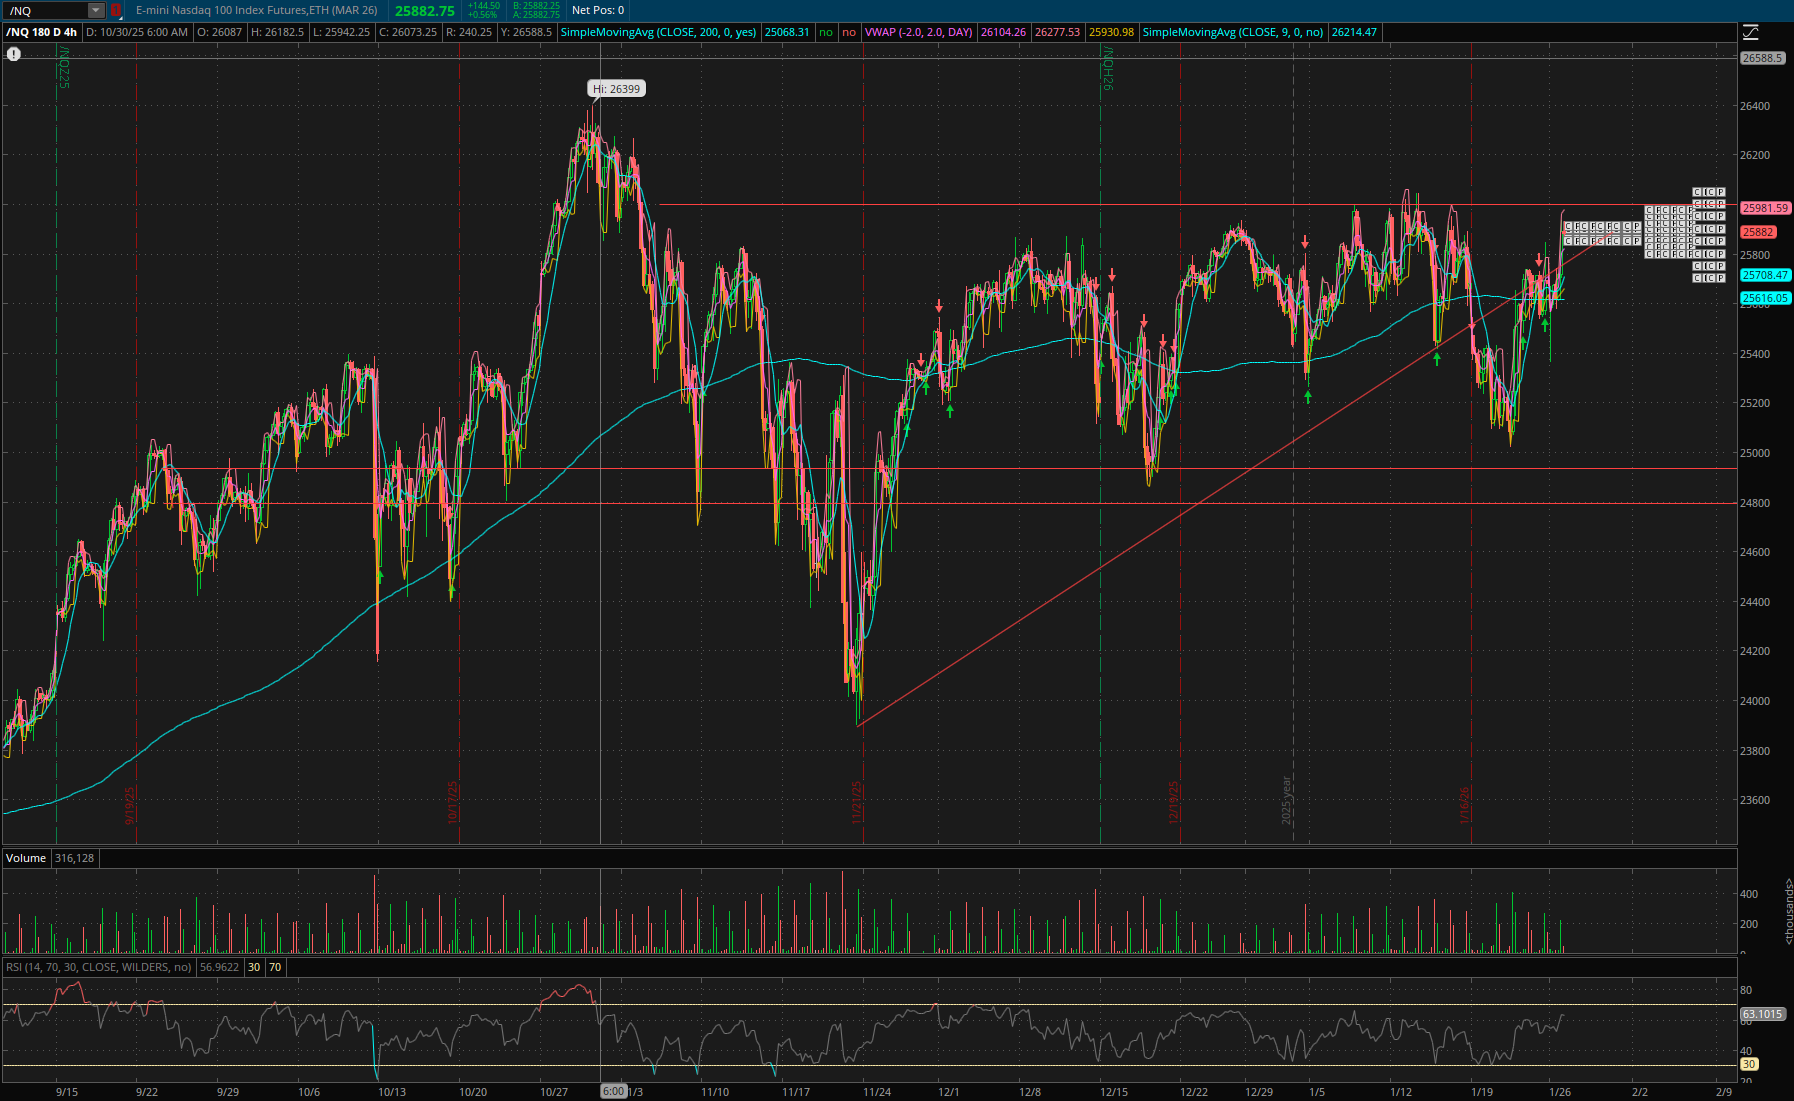
Click to enlarge — /NQ 180-day chart showing the breakout setup approaching previous highs
Coming into Monday, /NQ had consolidated and rebounded, showing momentum with confidence. After a dip, it rebounded and was approaching its previous high for a potential breakout. The economy had uncertainty around the Fed chair nominee, with a Fed meeting scheduled for the week (market sentiment expected no rate change). Overall, markets were not in a panic, and three months of upward movement signified a strong upward trend. There was a large dip on 1/18 which was fully recovered by 1/26, and technical analysis was showing bullish markers signifying further upward trend for a possible breakthrough of the previous all-time high.
Technical Analysis Indicators Explained
Several key technical indicators supported my bullish thesis:
1. Moving Averages (9 SMA & 200 SMA)
Moving averages smooth out price data to identify trend direction. I use two key moving averages: the 9-period Simple Moving Average (SMA) for short-term momentum, and the 200-period SMA as the long-term trend indicator. When price trades above both moving averages, it confirms bullish momentum. The 9 SMA acts as dynamic support during uptrends, while the 200 SMA represents the broader market sentiment. On my charts, price was holding firmly above both averages, confirming the uptrend.
2. VWAP (Volume Weighted Average Price)
VWAP calculates the average price weighted by volume throughout the trading session. Institutional traders often use VWAP as a benchmark for order execution. When price is trading above VWAP, it indicates bullish intraday sentiment and suggests buyers are in control. In my analysis, the market consistently held above VWAP, providing additional confirmation of buyer dominance.
3. RSI (Relative Strength Index)
The RSI is a momentum oscillator that measures the speed and magnitude of price movements on a scale of 0 to 100. I use standard settings (14-period) with 70 as overbought and 30 as oversold levels. While some traders avoid buying when RSI approaches overbought territory, strong uptrends often see RSI remain elevated for extended periods. The key is looking for RSI to hold above 50 during pullbacks, which indicates underlying strength.
4. Support and Resistance Levels
Horizontal support and resistance levels mark price zones where buying or selling pressure has historically emerged. The critical observation was NQ approaching its previous swing high (resistance). A decisive break above this level transforms former resistance into support and often triggers momentum buying as shorts cover and breakout traders enter. This anticipated breakout was the primary signal that prompted my entry.
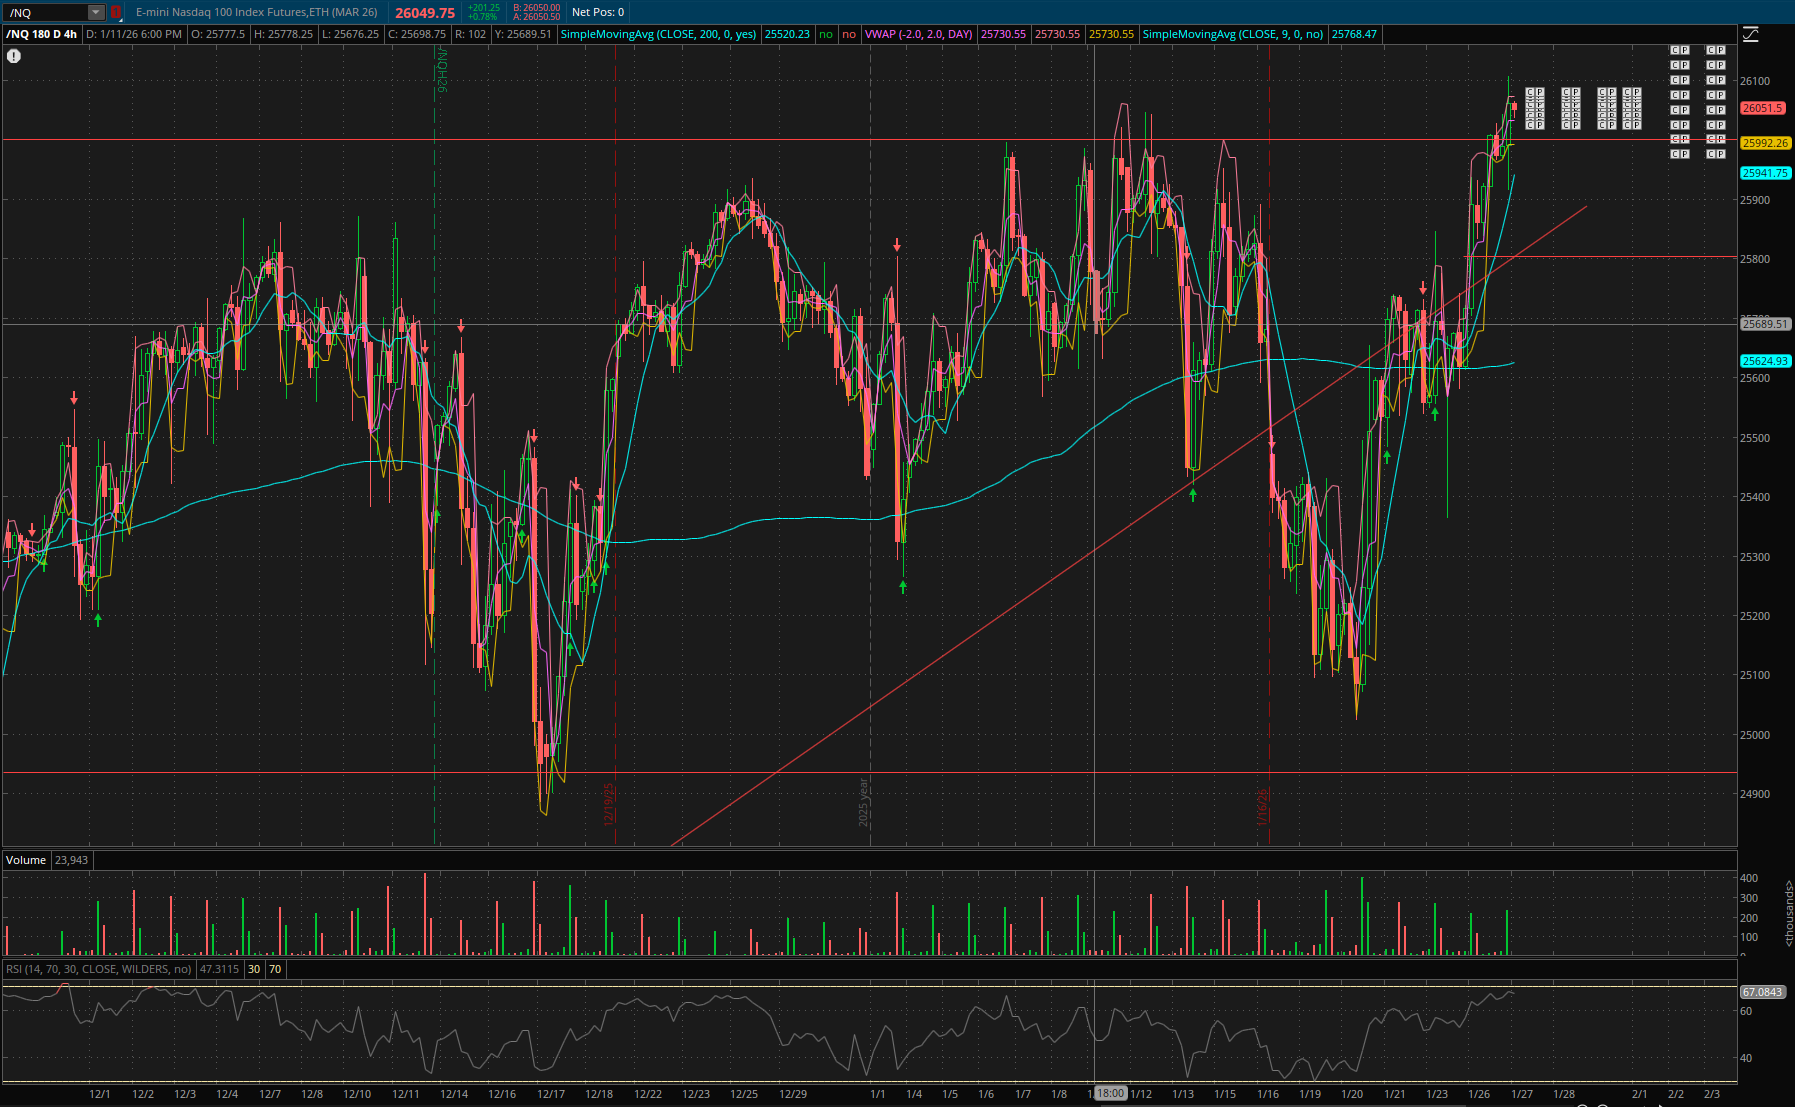
Click to enlarge — /NQ approaching key resistance level for potential breakout
5. Volume Analysis
Volume validates price movements. A breakout accompanied by above-average volume carries more conviction than one on light volume. When analyzing the charts, I looked for volume expansion on up-moves and volume contraction on pullbacks, which is the hallmark of healthy accumulation. This volume pattern supported the case for a genuine breakout rather than a false move.
Understanding the Options Greeks
Options traders must understand the Greeks, which measure different risk dimensions of an options position:
| Greek | Value | What It Means |
|---|---|---|
| Delta | 25.49 | For every $1 move in VOO, the option gains/loses approximately $0.25 |
| Theta | -40.82 | Time decay costs approximately $0.41 per day |
| Gamma | 4.34 | Rate of change in Delta; high gamma means rapid P/L swings |
| Vega | 19.01 | Sensitivity to volatility changes |
With only 3 days until expiration, theta decay is significant. This is a high-conviction, short-duration trade where I need the underlying to move quickly in my favor. The relatively low delta (25.49) reflects that this is an out-of-the-money call, requiring VOO to rally toward $645 for maximum profit.
After Action Report
Monday — Jan 26, 2026 (Position Opened)
Open: $635.03 | Mid-day: $637.50 | Close: $637.06 | Day Change: +0.03%
VOO opened at $634.47, hit a high of $638.39, and closed at $637.06. After hours, VOO reached a high of $639.43. Technical analysis showed bullish markers signifying further upward trend for a possible breakthrough of the previous all-time high and potentially setting a new support level for further upward movement. I entered the VOO $645 call position.
Tuesday — Jan 27, 2026
Open: $638.42 | Mid-day: $639.80 | Close: $639.74 | Day Change: +0.02%
Position P/L: +28.58% (mid-day)
NQ rose about 1% today. Momentum upwards still looked strong. VOO opened at $638.66, reached a high of $640.06, and closed at $639.74. After hours, VOO was trading above VWAP and the 9-day SMA, showing continued upward movement.
Wednesday — Jan 28, 2026
Open: $641.04 | Mid-day: $639.00 | Close: $639.61 | Day Change: -0.2%
Warning signs emerged
Opened above previous close, but Tuesday’s after-hours experienced big downward movement after reaching a high of $642.84. Wednesday opened at $641.04, dipped to $638.22 mid-day, then closed at $639.59. In hindsight, Wednesday morning should have been my exit point — the previous day’s after-hours did not carry price up to the $642 range into the open, failing to show good carry-through and upward trend. Mid-day was straddling a key support/resistance level. I decided to hold and see after-hours, setting a rule: after-hours would need to reach and hold $643 to justify holding through Thursday.
Thursday — Jan 29, 2026 (Position Closed)
Open: $640.43 | Mid-day: $635.50 | Close: $638.24 | Day Change: -0.3%
VOO Position Closed: -41.2%
Opened slightly above previous close but without any upward trend. Momentum was lost, price consolidated for too long, and confidence evaporated. Opened at $640 but was way below our expected price target, so I closed the position at market open for $0.48, realizing a -41% loss on this VOO contract.
Following market open, VOO took a large dip, reaching a low of $629.82 two hours into the trading session — a -1.7% downfall from the opening bell. This is where statistical analysis became critical to identifying the recovery opportunity.
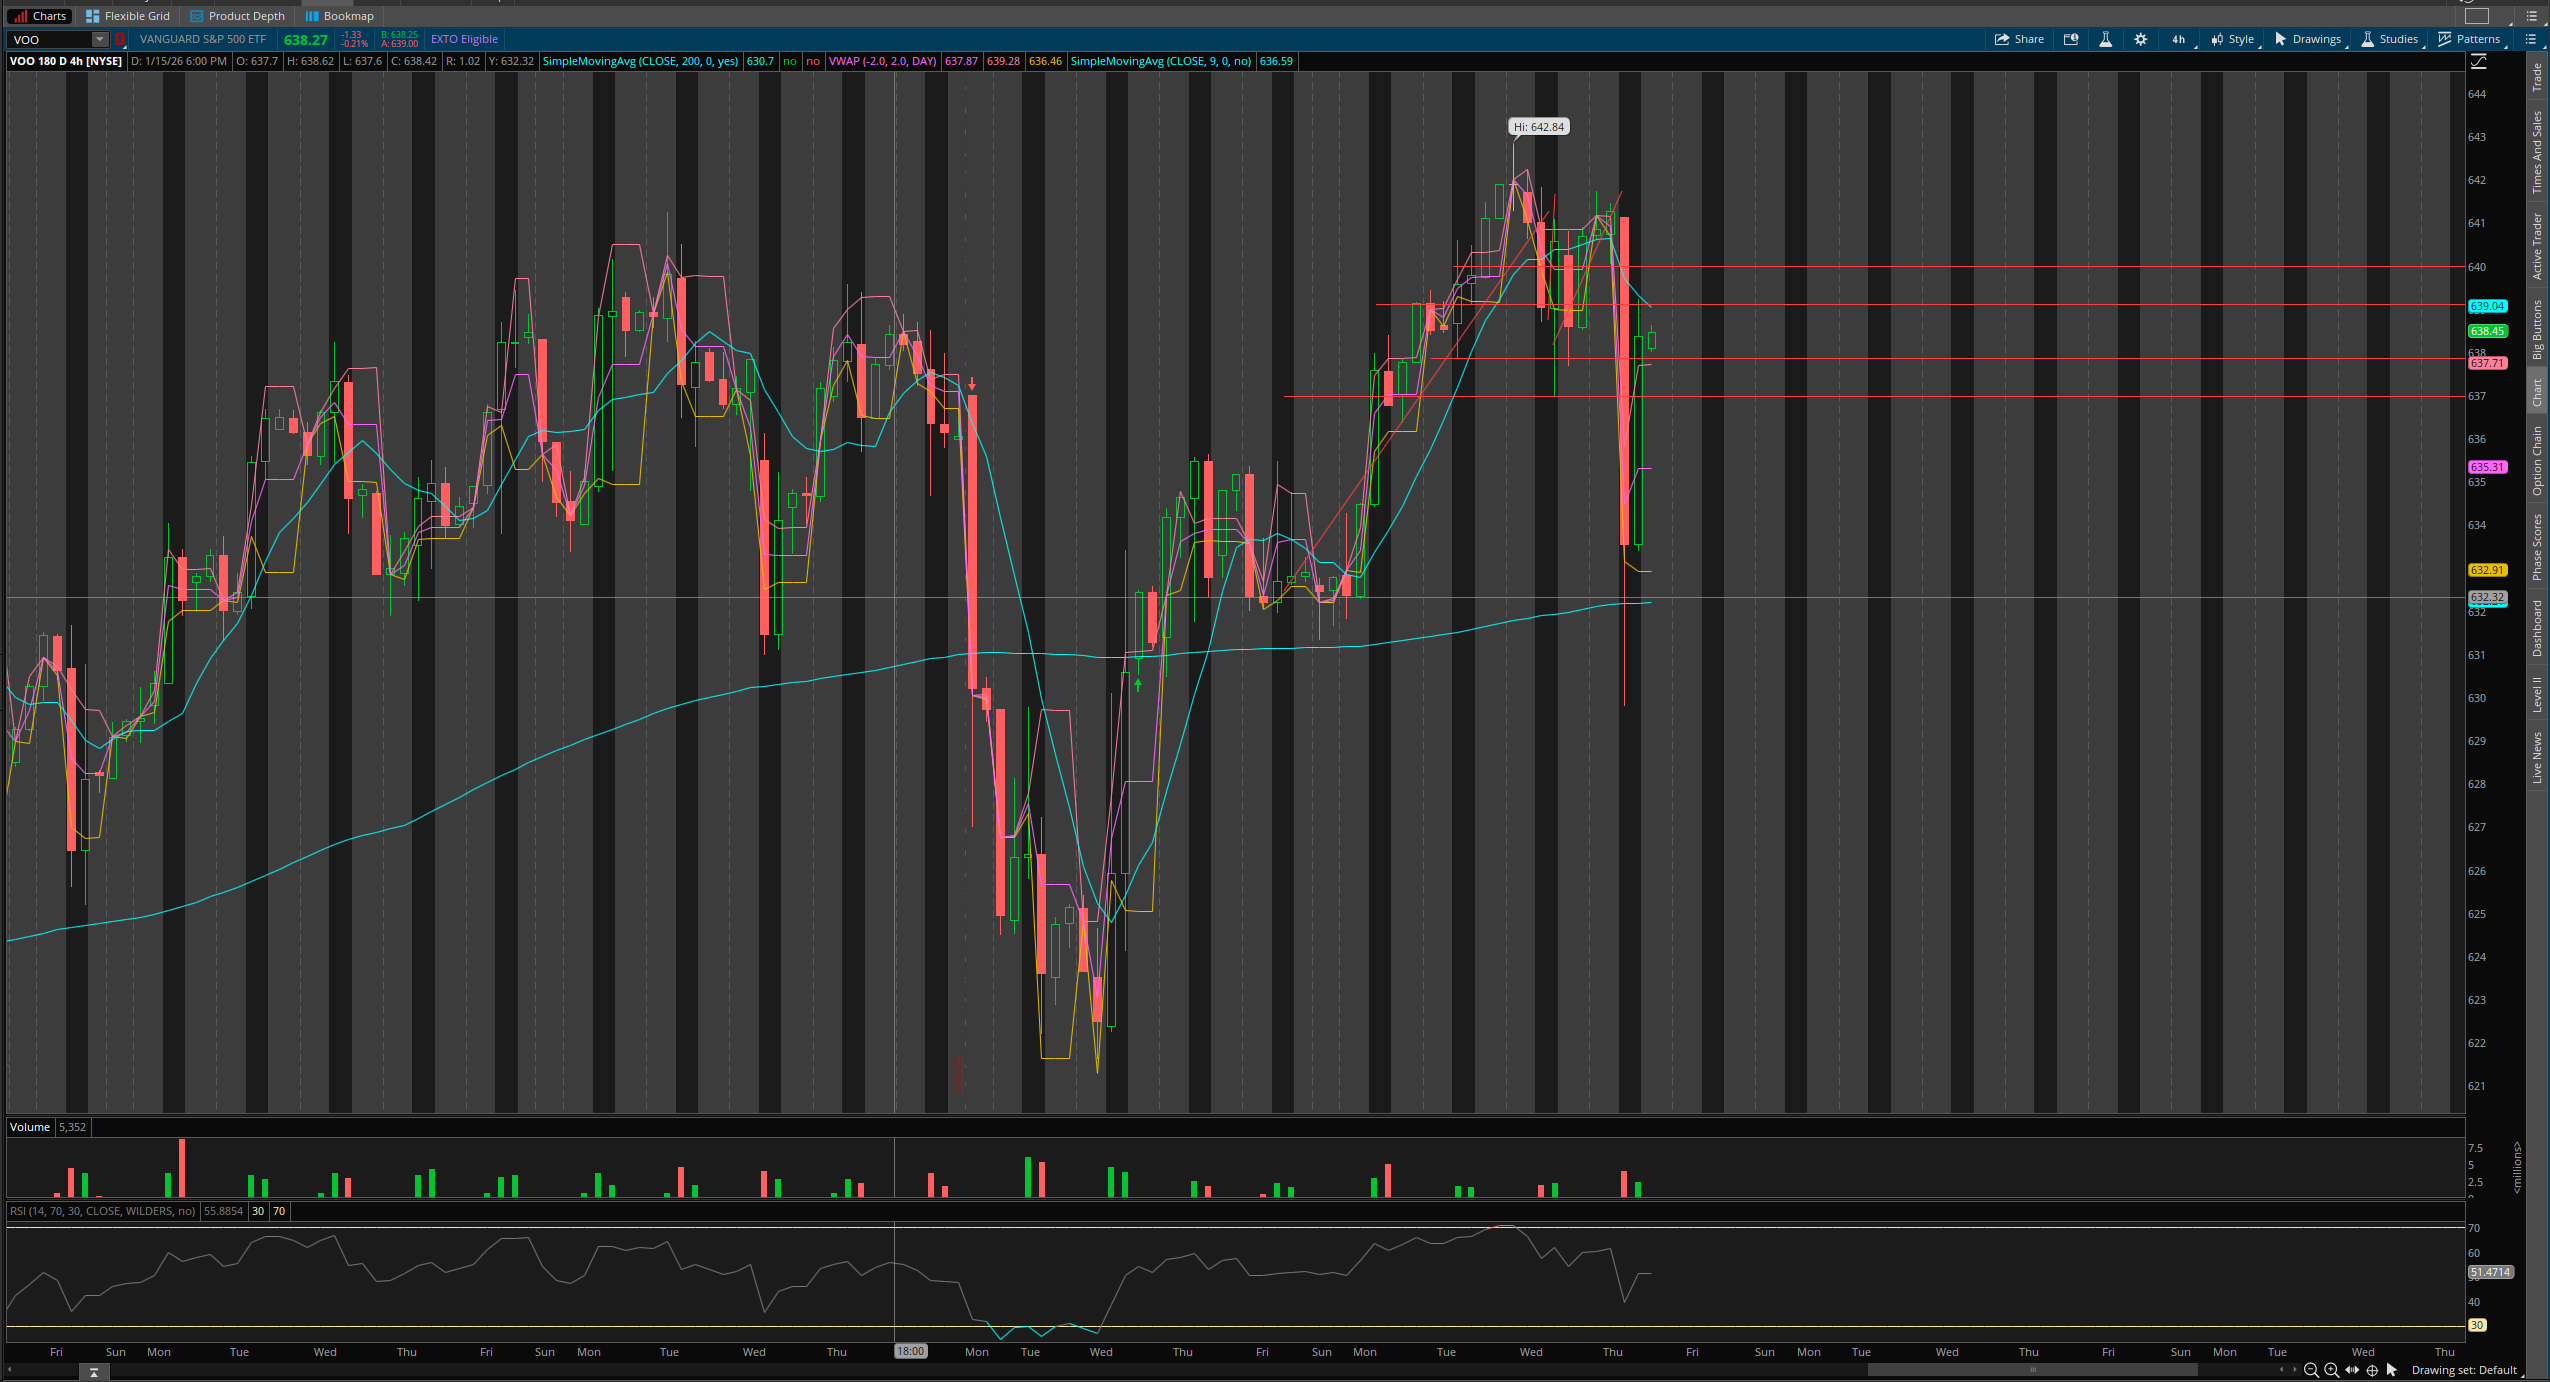
Click to enlarge — VOO showing the -3.6σ dip that triggered the mean-reversion play
Standard Deviation Analysis: Identifying the Mean-Reversion Setup
To quantify how extreme Thursday’s dip was, I calculated the standard deviation of price movements using the prior 20 closing bars as a baseline. Standard deviation (σ) measures the typical range of price fluctuations — when price moves significantly beyond this normal range, it often signals an overextended condition ripe for reversion.
20-Bar Baseline Calculation:
• Collected closing prices from the prior 20 bars
• Calculated mean and standard deviation of price changes
• Thursday’s dip: -3.6σ downside deviation
Why -3.6σ matters: In a normal distribution, approximately 99.7% of all price movements fall within ±3σ. A move beyond -3σ is statistically rare — occurring less than 0.15% of the time. When price extends this far from its mean, the probability of a snapback increases significantly. This isn’t a guarantee, but it shifts the odds in favor of mean reversion.
The -3.6σ reading told me the market had likely overreacted to the downside. Sellers were exhausted, and the statistical rubber band was stretched to its limit. Combined with the broader context — an overall upswing from the 1/21 lows still intact — this created a high-probability setup for a bounce.
Recovery Trade: QQQ $636 Call
Armed with the mean-reversion thesis from the -3.6σ signal, I entered a QQQ $636 call at 11:43 AM PT. I chose QQQ over VOO for the recovery play because tech-heavy indices tend to exhibit stronger snapback momentum after oversold conditions.
The thesis played out within hours. As the statistical rubber band snapped back, QQQ rallied into the afternoon session. I closed the position at 12:58 PM PT — just over an hour later — realizing a +102.6% profit on this contract.
The same statistical framework that missed the VOO breakout became the edge that salvaged the week.
Friday — Jan 30, 2026
Open: $636.23 | Close: $636.33 | Day Change: +0.2%
No positions — observing
The market showed downward movement and weak technicals. Sideways consolidation dominated. Overall, still showing downward pressure from the previous large dip. No signs of recovery at the closing bell.
Key Takeaways
This trade illustrates several important principles:
Correlation Matters: When NQ shows strength, S&P 500-linked instruments like VOO typically follow. Using index futures as a leading indicator for ETF trades can provide an edge.
Multiple Confirmations: No single indicator should drive a trade decision. The combination of moving average alignment, VWAP positioning, RSI momentum, and a resistance breakout created a higher-probability setup.
Understand Your Greeks: Short-dated options carry significant theta risk. Know what you are paying for time and ensure your thesis can play out within the available window.
Defined Risk: Options allow for leveraged exposure with known maximum loss. This trade risked $81.66 for potential multiples in return if the breakout materializes.
Know When to Exit: Wednesday morning showed the breakout thesis was failing — after-hours didn’t carry through to higher prices at the open. Recognizing failed setups early limits losses.
Adapt to Conditions: The -3.5σ dip on Thursday created a mean-reversion opportunity. Pivoting to the QQQ call captured +102.6% and turned a losing week into a +21.96% weekly gain.
Weekly Result: +21.96%
VOO loss offset by QQQ recovery trade. Discipline and adaptation saved the week.
Disclaimer: This article is for educational purposes only and does not constitute financial advice. Options trading involves substantial risk and is not suitable for all investors. Past performance does not guarantee future results. Always conduct your own research and consider consulting a licensed financial advisor before making investment decisions.